A profit volume cost Template is a structured way to organize the numbers needed to understand how selling price, sales volume, variable costs, fixed costs, and operating profit interact. The idea is closely related to cost-volume-profit analysis, commonly called CVP analysis. A well-designed worksheet can turn a collection of accounting figures into a practical planning model that shows the sales level needed to cover costs, reach a target profit, and evaluate the effect of changing important assumptions.
The most useful models begin with a small number of clearly identified inputs: selling price per unit, variable cost per unit, total fixed costs, expected sales volume, and, when relevant, a target operating profit. From these inputs, the worksheet can calculate contribution margin, contribution margin ratio, break-even volume, break-even revenue, target-profit volume, and margin of safety. These calculations are useful for budgeting, pricing reviews, product planning, and short-term decision making.
This article explains how to structure a reliable model, which calculations belong in it, how to create charts, how to use Excel or Google Sheets, and how to interpret the results without treating the model as a prediction of every future business outcome. The examples below are hypothetical and are intended to demonstrate the mechanics rather than represent the performance of a real company.
What Is Cost Volume Profit?
What is cost volume profit analysis? It is a managerial accounting method used to examine how changes in sales volume, selling price, variable cost, fixed cost, and product mix can affect operating profit. The central relationship is simple: sales revenue minus variable costs produces contribution margin, and contribution margin minus fixed costs produces operating profit.
The cost volume profit definition is therefore broader than a simple break-even calculation. Break-even is one result within the larger analysis. A complete model can answer several related questions: how many units are needed to avoid a loss, how much revenue is needed to reach a target profit, how much profit changes when volume changes, and how pricing or cost changes alter the required sales level.
The cost volume profit definition also depends on several simplifying assumptions. Traditional CVP analysis generally assumes a linear relationship between relevant costs and activity, a stable selling price and variable cost per unit within the relevant range, and a reliable classification of costs as fixed or variable. These assumptions make the mathematics useful, but they also mean that the result should be reviewed whenever business conditions move outside the model’s relevant range.

Why Use a Profit Volume Cost Template?
A good template reduces the amount of repetitive calculation required when management wants to compare different sales scenarios. Instead of calculating each case manually, the user can change the input cells and let the linked formulas update the contribution margin, break-even point, expected profit, and related measures.
The model also makes the relationship between cost behavior and profitability easier to see. Fixed costs create the initial hurdle that contribution margin must cover. Variable costs rise with activity, while the contribution margin generated by each additional unit can be used first to absorb fixed costs and then to increase operating profit once the break-even point has been passed.
This structure makes the worksheet useful for a wide range of planning questions. A business might evaluate whether a price reduction requires additional volume, whether a proposed increase in rent changes the minimum sales target, or whether a reduction in variable cost creates enough additional contribution to justify a process change.
Core Components of the Model
The first component is selling price per unit. This is the revenue received for each unit sold under the assumption used in the model. For a service business, the unit could be a consultation, subscription, project, customer transaction, or another measurable activity. The chosen unit should be consistent throughout the worksheet.
The second component is variable cost per unit. These are costs expected to change with the number of units sold or another activity measure. Examples can include direct materials, transaction-related fees, packaging, sales commissions, or other costs that have a meaningful variable relationship with activity. The classification should be based on the business’s actual cost behavior rather than simply on whether an expense seems large or small.
The third component is total fixed costs. These are costs that remain constant in total within the relevant operating range. Rent, certain salaries, insurance, and some administrative expenses can be fixed for a particular planning period. However, a cost that is fixed for one range of activity may change when capacity expands, so the model should not assume that fixed costs remain unchanged indefinitely.

Contribution Margin: The Key Bridge Between Sales and Profit
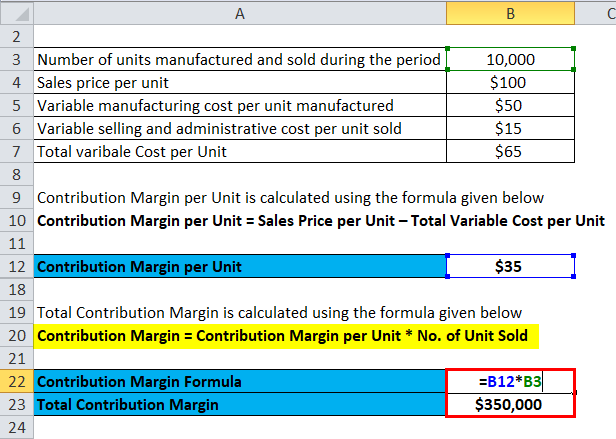
Contribution margin is one of the most important concepts in a CVP worksheet. At the unit level, it is calculated by subtracting variable cost per unit from selling price per unit. The resulting amount is what each unit contributes toward covering fixed costs and, after fixed costs have been covered, operating profit.
For example, suppose a hypothetical product sells for $80 and has a variable cost of $50 per unit. The unit contribution margin is $30. If the company sells 1,000 units, total contribution margin is $30,000. If fixed costs are $24,000, the hypothetical operating profit is $6,000.
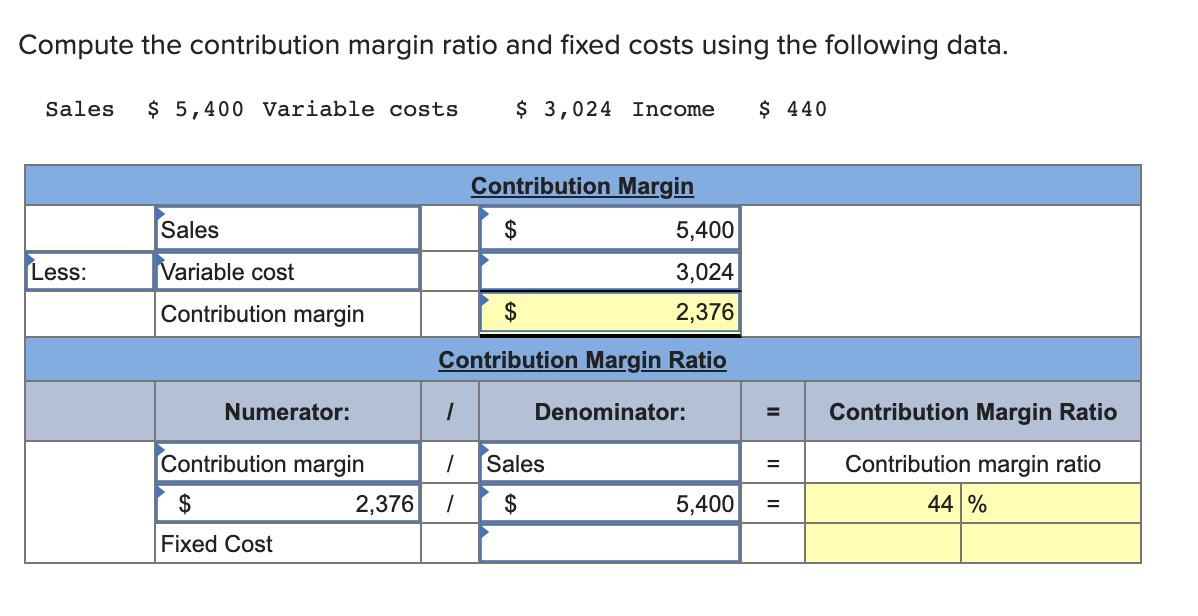
The contribution margin ratio expresses the same relationship as a percentage of sales. In the example above, the ratio is $30 divided by $80, or 37.5%. This means that, under the model’s assumptions, each dollar of sales contributes $0.375 toward fixed costs and operating profit after variable costs have been covered.
Cost Volume Profit Formulas to Include
A practical worksheet should keep the formulas visible and logically connected. The basic profit equation is: Profit = Sales Revenue − Total Variable Costs − Total Fixed Costs. If selling price per unit is represented by P, variable cost per unit by V, units sold by Q, and fixed costs by F, the equation can be written as Profit = (P × Q) − (V × Q) − F.
The most frequently used cost volume profit formulas begin with contribution margin. Unit contribution margin equals selling price per unit minus variable cost per unit. Total contribution margin equals total sales minus total variable costs. Contribution margin ratio equals contribution margin divided by sales revenue.
These calculations lead directly to the break-even formulas. Break-even units equal fixed costs divided by unit contribution margin. Break-even sales dollars equal fixed costs divided by the contribution margin ratio. For target profit, add the desired profit to fixed costs before dividing by the relevant contribution measure. These relationships are consistent with standard managerial accounting treatments of CVP analysis.
Break-Even in Units
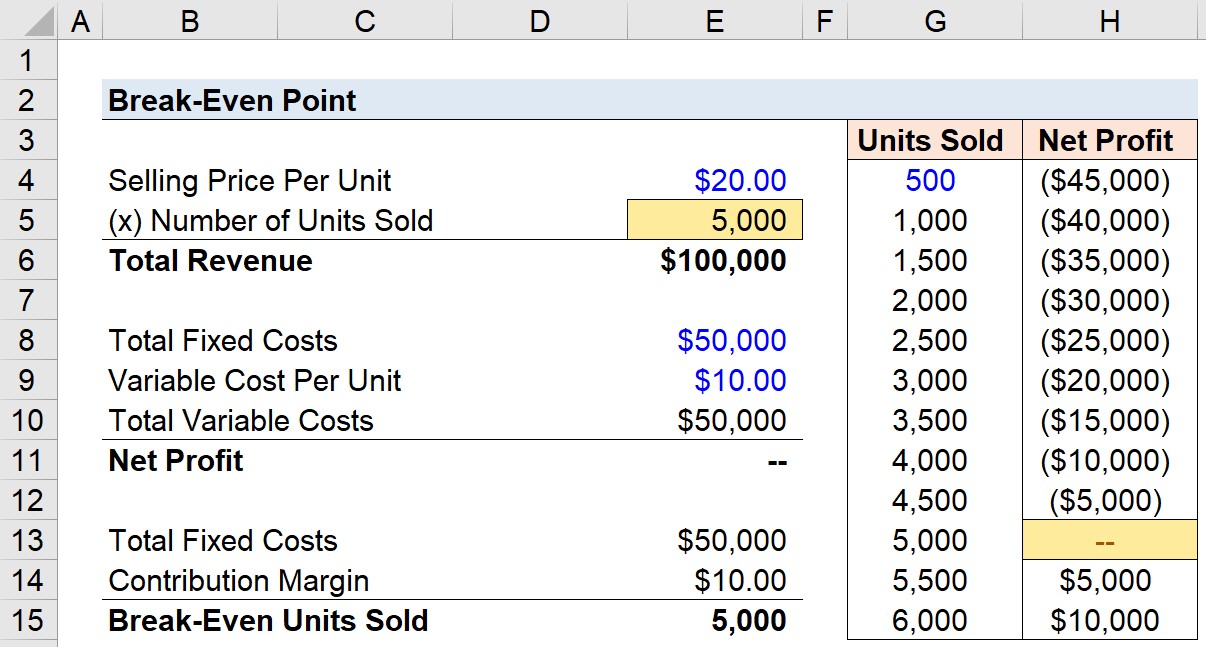
The break-even point in units identifies the quantity that produces zero operating profit under the model assumptions. The formula is Break-even units = Fixed Costs ÷ Contribution Margin per Unit. If fixed costs are $24,000 and contribution margin is $30 per unit, the break-even volume is 800 units.
At exactly 800 units in this hypothetical example, total contribution margin equals $24,000 and therefore covers the fixed costs. Sales below that level produce a modeled operating loss, while sales above that level produce a modeled operating profit, assuming the selling price, variable cost, and fixed-cost assumptions remain valid.
A worksheet should avoid rounding the break-even figure too early. If the calculation produces 800.4 units, a business selling whole units would normally need to consider the next whole unit when setting a minimum physical sales target. The underlying decimal figure should remain available for financial analysis even when an operational target is rounded.
Break-Even in Sales Revenue
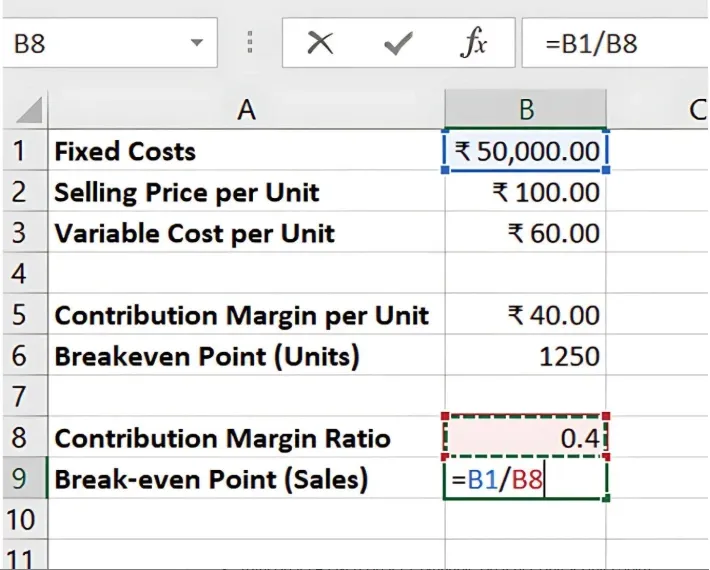
Break-even can also be expressed in currency rather than units. This is particularly useful for businesses with multiple products or services where a single physical unit does not represent the entire sales mix. The standard formula is Break-even sales = Fixed Costs ÷ Contribution Margin Ratio.
Using the hypothetical example with fixed costs of $24,000 and a contribution margin ratio of 37.5%, break-even revenue would be $64,000. This agrees with the unit calculation because 800 units multiplied by the $80 selling price also produces $64,000.
The sales-dollar calculation is often more practical for businesses that sell many products at different prices. However, a multi-product model must use a reasonable sales mix assumption because changing the proportion of products sold can change the weighted contribution margin and therefore change the break-even point.
Building the Spreadsheet Structure
A clean profit volume cost template excel workbook can begin with an input block at the top. Suggested fields include selling price per unit, variable cost per unit, fixed costs, expected unit volume, and target profit. Inputs should be visually separated from calculated cells so that users know exactly which numbers they are expected to change.
Below the inputs, create a calculation block. Include unit contribution margin, contribution margin ratio, total sales, total variable cost, total contribution margin, total fixed cost, operating profit, break-even units, break-even sales, target-profit units, and target-profit sales. Keeping the calculations in a consistent order makes the model easier to audit.
A separate scenario block can then compare a base case with alternative assumptions. For example, one column could represent the current price and volume, another could represent a higher price, and another could represent lower volume. The important point is that each scenario should use the same underlying logic so that differences in results can be traced to changed assumptions.

Using Excel and Google Sheets
A profit volume cost template google sheets model can use the same basic logic as an Excel workbook. The important issue is not the brand of spreadsheet environment but the structure of the formulas, the quality of the source numbers, and the consistency of cell references.
For example, if cell B2 contains selling price, B3 contains variable cost per unit, B4 contains fixed costs, and B5 contains units sold, a simple contribution margin formula can be written as B2-B3. Total revenue can be calculated from B2 multiplied by B5, while total variable cost can be calculated from B3 multiplied by B5. Profit can then be calculated by subtracting variable cost and fixed cost from revenue.
Google Sheets and Excel can also be used to create line charts from a volume schedule. A useful schedule may contain units in one column, revenue in another, total variable cost in another, total fixed cost in another, total cost in another, and profit in another. Linking the chart to this schedule makes it easier to inspect how results change as volume rises.

Using a Profit Volume Cost Template Excel Free of Unnecessary Complexity
Although many spreadsheet models can become highly detailed, a useful model does not need dozens of tabs. A small business may only need an input section, calculation section, volume schedule, scenario section, and one or two charts. The goal is to make the logic easy to inspect rather than to create a complicated workbook that only its creator understands.
For readers searching for a profit volume cost template pdf, a printable version can be useful for reviewing assumptions, presenting a planning case, or keeping a static record of a scenario. A PDF should be treated as a reporting format rather than the primary calculation environment because changing assumptions is much easier in a spreadsheet.
A cost and profit template is most useful when its labels are precise. Avoid vague fields such as “cost” when you actually mean variable cost per unit or fixed cost per month. Clear labels reduce the risk of entering a total cost into a per-unit field or mixing monthly and annual figures.

Creating a Cost Volume Profit Chart
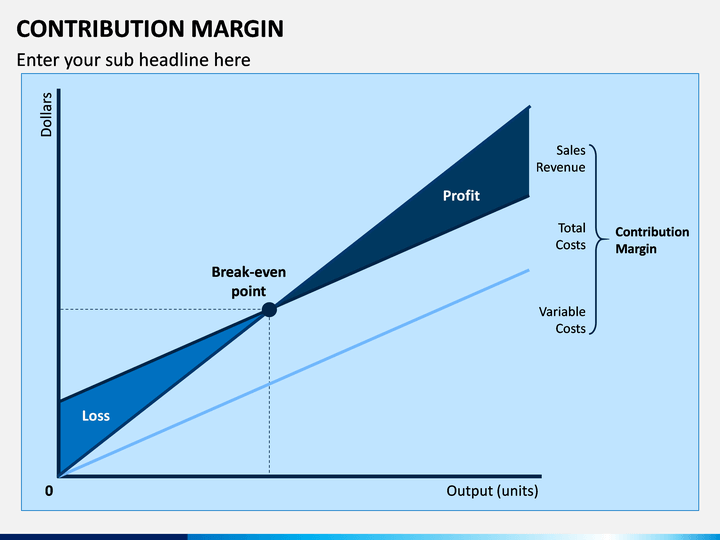
A cost volume profit chart translates the calculations into a visual relationship. The horizontal axis normally represents units or another activity measure, while the vertical axis represents money. The revenue line generally starts at zero when volume is zero, while the total cost line starts at the fixed-cost level.
The point where the revenue line and total cost line intersect represents break-even. To the left of that point, total costs exceed revenue under the standard linear assumptions. To the right, revenue exceeds total costs and the difference represents operating profit.
The chart is valuable because it can communicate the model quickly. A decision maker can see not only the break-even point but also the distance between expected volume and break-even volume. That visual distance helps explain the margin of safety and makes a scenario discussion easier to follow.

Understanding the Cost Volume Profit Graph
A cost volume profit graph should be constructed from the same assumptions used in the worksheet. If the graph uses one selling price while the calculation block uses another, the visual and numerical results will disagree. This is why the graph should reference calculation cells rather than contain manually typed values.
A standard graph may show sales revenue, total costs, and fixed costs. A profit-volume version can instead place operating profit or loss on the vertical axis and sales volume on the horizontal axis. The profit line crosses the zero-profit level at break-even, making the change from loss to profit immediately visible.
For a multi-product business, a single graph can become misleading if the sales mix changes substantially. In that situation, the worksheet should state the assumed product mix and calculate a weighted contribution margin. If the mix changes, the model should be rerun rather than treating the original break-even point as permanent.
Target Profit Planning
Break-even answers the question of when profit reaches zero, but managers often need a more useful target. Target-profit analysis asks how many units or how much revenue must be generated to produce a specified operating profit.
The unit formula is Required Units = (Fixed Costs + Target Profit) ÷ Contribution Margin per Unit. For example, suppose fixed costs are $24,000, unit contribution margin is $30, and the target operating profit is $12,000. Required units are ($24,000 + $12,000) ÷ $30, or 1,200 units.
For revenue-based planning, use Required Sales = (Fixed Costs + Target Profit) ÷ Contribution Margin Ratio. A good template should display both forms when the business has a meaningful unit definition. Showing the two results side by side also provides a useful internal check because they should reconcile under consistent assumptions.

Margin of Safety and Operating Leverage
Margin of safety measures the amount by which expected or actual sales exceed break-even sales. It can be stated in units, currency, or percentage terms. A simple unit version is expected units minus break-even units, while the percentage version divides the margin of safety by expected sales.
This measure adds useful context to the break-even result. Two businesses could have the same break-even point but very different expected sales levels. The business operating much farther above break-even has a larger modeled cushion before sales fall to the point where operating losses begin.
Operating leverage provides another perspective. A business with relatively high fixed costs may experience larger changes in operating profit when sales volume changes, because a larger portion of contribution margin remains available after fixed costs have been covered. A template can include degree of operating leverage as a supplementary measure, but it should not be interpreted without considering the relevant operating range.
Multi-Product CVP Analysis
Single-product analysis is straightforward because one unit has one selling price and one variable cost. Multi-product analysis is more involved because each product can have a different contribution margin. The model therefore needs a sales-mix assumption or a weighted-average contribution margin.
Suppose a hypothetical business sells Product A and Product B. Product A may produce a higher contribution per unit but represent a smaller proportion of total sales. Product B may have a lower contribution per unit but represent most of the sales. Looking only at the contribution per unit could therefore give an incomplete picture of the overall break-even requirement.
A strong template should show the sales mix, expected units, selling price, variable cost, unit contribution margin, total contribution, and contribution percentage for each product. The combined calculation can then show the weighted contribution measure used to estimate the overall break-even point.

Sensitivity Analysis
CVP models become much more useful when they can test changes in assumptions. Sensitivity analysis can compare scenarios such as a 5% price increase, a 10% volume decline, a higher variable cost, or an increase in fixed expenses. Each scenario should change only the intended variables so the effect can be traced clearly.
For example, consider a hypothetical base case with a selling price of $100, variable cost of $60, fixed costs of $20,000, and volume of 800 units. A price increase would raise contribution per unit if volume remained constant. A variable-cost increase would reduce contribution per unit. An increase in fixed costs would leave unit contribution unchanged but raise the break-even requirement.
The best sensitivity section presents the assumptions and results together. Useful output fields include revenue, variable cost, contribution margin, fixed costs, operating profit, break-even units, break-even sales, and margin of safety. This allows a decision maker to see not only whether profit changes, but also why the change occurs.

Common Errors in a CVP Worksheet
One common error is mixing fixed and variable costs. If a cost that changes significantly with volume is treated as fixed, the resulting contribution margin and break-even point can be misleading. The reverse problem can also occur when a genuinely fixed expense is incorrectly treated as a variable cost per unit.
Another error is mixing time periods. A monthly fixed-cost figure should not be compared with annual sales unless the periods are deliberately converted. Similarly, a variable cost per unit should be paired with a sales volume measured over the same relevant period.
A third problem is ignoring changes in price, cost, capacity, or product mix. CVP analysis is not a guarantee that a business will achieve a particular profit. It is a model based on assumptions. When those assumptions change materially, the worksheet should be updated and the result reassessed.

Practical Solution
Start by collecting the most reliable figures available for selling prices, variable costs, fixed costs, and expected sales volume. Separate each cost according to its behavior within the relevant range rather than relying on broad accounting categories. If a cost contains both fixed and variable elements, identify a reasonable method for separating those components before entering them into the model.
Next, build the worksheet in layers. Put assumptions in one clearly labeled area, calculations in a second area, and scenario results in a third. Use formulas that reference the input cells rather than typing the same number repeatedly. Then add a volume schedule and a cost volume profit chart that uses the same calculated values. This structure makes the model easier to inspect and update.
Finally, test the model before relying on its results. Set volume to zero and confirm that revenue and variable costs behave as expected while fixed costs remain in the model. Set volume to the calculated break-even level and confirm that operating profit is approximately zero. Then change one assumption at a time and confirm that the results move logically. This validation process is often more valuable than adding unnecessary complexity.
Choosing the Right Output Format
An editable spreadsheet is normally the most useful working format because assumptions can be changed and calculations can update immediately. The profit volume cost template excel format is especially useful when a business already has established spreadsheet workflows, reporting conventions, or financial models.
A profit volume cost template google sheets format can be convenient when several authorized users need to review the same planning model. Regardless of the spreadsheet environment, protect formula cells, label input cells clearly, and maintain consistent units of measurement. A collaborative worksheet is only useful if everyone understands which cells are intended to be changed.
A profit volume cost template pdf is better suited to a fixed report or printed planning document. It should show the assumptions, major calculated results, chart, scenario notes, and date of preparation. If the underlying assumptions later change, the report should be regenerated so that readers do not confuse an old scenario with the current planning case.
How to Review a Completed Model
Begin the review with the input assumptions. Ask whether the selling price reflects the intended transaction, whether variable costs include all meaningful per-unit costs, and whether fixed costs cover the full relevant period. Check that currency, unit volume, and time period are consistent.
Then review the contribution margin. If the margin is negative or unexpectedly small, investigate before relying on the break-even result. A negative unit contribution margin means that increasing sales of the modeled product does not provide the expected contribution toward fixed costs under the stated assumptions.
After that, review the break-even point and target-profit requirement. Compare them with realistic capacity and expected demand. A mathematically correct target may still be operationally unrealistic if the required volume exceeds available capacity or if the assumed selling price cannot be sustained in the market.
When the Model Needs More Detail
A basic CVP model is most useful for relatively stable short-term assumptions. More detail may be required when costs contain multiple activity drivers, prices vary by customer, products have different margins, or capacity changes at specific volume thresholds. In such situations, a simple straight-line model may hide important relationships.
Step costs are one example. A business might operate with one facility up to a certain volume and then need another facility or shift once that threshold is exceeded. The fixed-cost assumption would then change rather than remaining flat across every possible sales level.
Demand uncertainty is another consideration. A CVP worksheet can calculate the volume needed to reach a target profit, but it does not by itself establish whether customers will actually purchase that volume. Sales forecasting, market research, capacity analysis, and pricing evidence should therefore be considered alongside the CVP model.
Practical Example of a Simple Model
Consider a hypothetical business with a selling price of $75 per unit, variable cost of $45 per unit, and fixed costs of $30,000. The unit contribution margin is $30. Break-even volume is therefore 1,000 units because $30,000 divided by $30 equals 1,000 units.
If the business wants a hypothetical operating profit of $15,000, the required volume becomes 1,500 units. The calculation is ($30,000 + $15,000) divided by $30. At 1,500 units, revenue would be $112,500, variable cost would be $67,500, contribution margin would be $45,000, and fixed costs would be $30,000, producing the $15,000 target profit.
The same example demonstrates why contribution margin matters. Revenue alone does not show how much of each sale remains after variable costs. By separating revenue, variable cost, contribution margin, and fixed cost, the worksheet makes the path from sales volume to operating profit transparent.
Reference Examples
The following visual references show different ways a profit volume cost Template can represent assumptions, calculations, break-even relationships, contribution margins, scenario comparisons, and target-profit planning. Some examples emphasize spreadsheet layouts, while others emphasize graphs or structured accounting calculations. They are useful for recognizing the types of fields and visual relationships that commonly appear in a CVP model. The examples should be treated as references for structure and presentation rather than as universal formats that every business must follow.
When evaluating a profit volume cost Template, look for clear separation between inputs and calculated outputs, consistent units, visible contribution-margin calculations, and a logical connection between sales volume and profit. The following references can help readers compare different layouts, recognize useful chart types, and understand how break-even and profitability information can be presented visually. A strong model should remain understandable even when several scenarios or products are included.
Contribution Margin Slide
Source: SketchBubble
Profit-Volume Chart
Source: SlideServe
Break-Even Analysis Worksheet
Source: Worksheets Library
Break-Even Point Calculation in Excel
Source: Kotak Neo
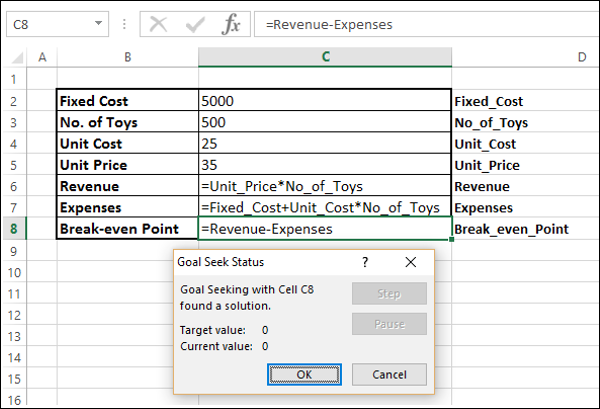
Break-Even Analysis with Goal Seek
Source: TutorialsPoint
Contribution Margin Calculation Example
Source: EDUCBA
CVP Analysis Cheat Sheet
Source: LinkedIn

CVP Analysis for Candace Company
Source: Studocu

Break-Even Analysis Graph
Source: WP ERP
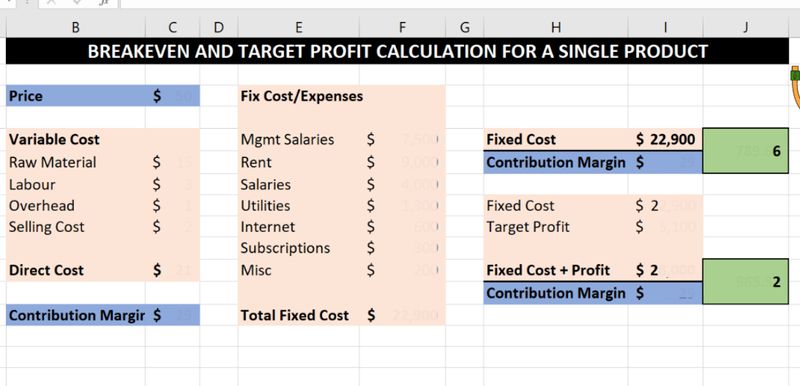
Break-Even Analysis Template
Source: InvoiceBerry

CVP-FC-Contrib-PL-BEP
Source: Wikimedia Commons

CVP-TC-Sales-PL
Source: Wikimedia Commons

CVP-TC-FC-VC
Source: Wikimedia Commons

CVP-Sales-Contrib-VC
Source: Wikimedia Commons

CVP-FC-Contrib-PL
Source: Wikimedia Commons

CVP-TC-FC-VC Compatibility Diagram
Source: Wikimedia Commons

Break-even analyse
Source: Wikimedia Commons

Break-even point
Source: Wikimedia Commons

Breakeven small
Source: Wikimedia Commons

LEB1BE
Source: Wikimedia Commons

Nollpunkt
Source: Wikimedia Commons

Coût SI
Source: Wikimedia Commons

US solar break-even cost
Source: Wikimedia Commons

Folie12
Source: Wikimedia Commons
