The most useful tracker is not necessarily the largest one. A practical workbook should make daily data entry simple while producing summaries that answer important business questions. What was sold? What remains unpaid? Which projects are late? Which activities are producing opportunities? Are expenses staying within expectations? Which priorities require action this week?
Spreadsheet-based tracking remains useful because Excel and Google Sheets can combine tables, formulas, filters, conditional formatting, charts, and collaboration features. Microsoft currently provides customizable Excel trackers for projects, sales leads, invoices, budgets, and other business activities, while Google Sheets is widely used for shared, browser-based spreadsheet workflows. :contentReference[oaicite:0]{index=0}
A tracker can also grow with the business. A freelancer might begin with income, expenses, clients, and tasks. A small online store might add orders, inventory, product profitability, returns, and customer information. A larger team might add owners, milestones, budgets, risks, dependencies, and management dashboards.
The goal of this guide is therefore broader than explaining one spreadsheet layout. It shows how to design, evaluate, customize, and use an online business tracker template so that the workbook becomes a useful operating tool rather than another document that becomes outdated after a few weeks.

What Is an Online Business Tracker Template?
An online business tracker template is a pre-structured digital worksheet or workbook used to record and monitor recurring business information. The word “online” can describe a browser-based spreadsheet such as Google Sheets, an Excel workbook stored and shared online, or a template designed for cloud collaboration.
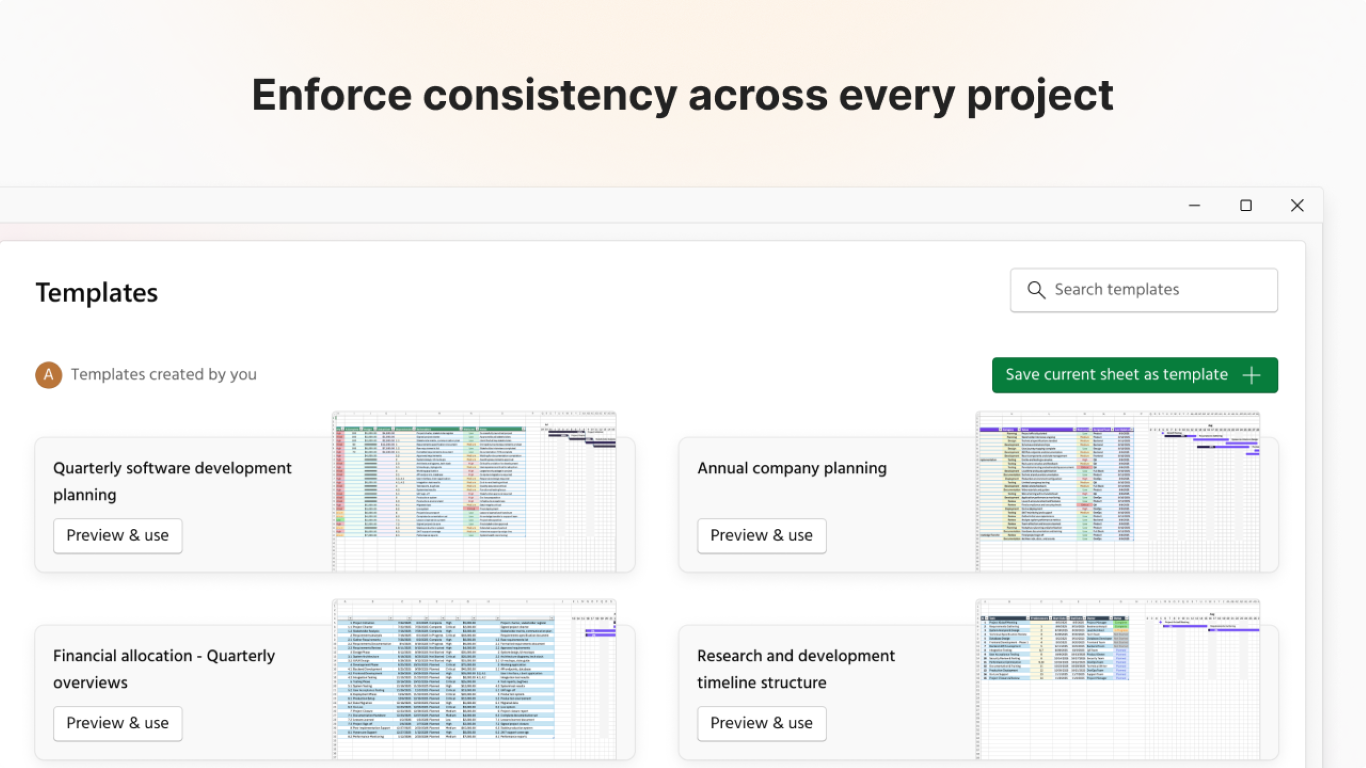
The template normally contains predefined columns, categories, formulas, status fields, and summary areas. Instead of deciding the entire structure every time information needs to be recorded, the user starts with a framework and adapts it to the business. This reduces setup work and encourages more consistent data entry.
A basic tracker might contain only Date, Activity, Owner, Status, Amount, Due Date, and Notes. A more advanced version can contain separate worksheets for transactions, customers, projects, sales opportunities, expenses, inventory, goals, dashboards, and reports.
The distinction between a tracker and a database is useful. A tracker is usually designed around practical monitoring and decision-making, while a database may be optimized for storing large amounts of structured information. A spreadsheet tracker can perform both functions at a modest scale, but it should remain simple enough for regular users to maintain.
The strongest design principle is visibility. A user should be able to enter information once and then understand what that information means. For example, a sales entry should contribute to sales totals, a project task should affect completion status, and an expense should appear in an appropriate financial summary without being manually copied several times.
Why Businesses Use Trackers
Businesses track information because activity alone does not explain performance. A company can have many sales conversations without knowing whether those conversations are moving toward revenue. A team can complete many tasks without knowing whether the tasks contribute to strategic priorities.
A tracker creates a common structure for observing progress. When every transaction uses the same fields and every project uses the same status categories, comparisons become easier. The business can identify trends, exceptions, bottlenecks, and unfinished work without reconstructing the information from multiple sources.
Trackers are particularly valuable for small businesses because they can provide structure before a company is ready for specialized software. Microsoft describes project trackers as centralized places for monitoring tasks, resources, deadlines, ownership, and status, while its business spreadsheet resources include budgeting, invoicing, inventory, forecasting, and other common business workflows. :contentReference[oaicite:1]{index=1}
A tracker can also improve accountability. Assigning an owner and due date to a task makes responsibility visible. Recording the next action for a sales opportunity makes follow-up easier. Recording the reason a deal was lost creates information that can later improve sales processes.
However, a tracker is only useful when it is maintained. A sophisticated workbook with dozens of unused columns can be less valuable than a simple sheet that is updated consistently. The best template therefore balances completeness with ease of use.
Core Components of an Effective Business Tracker
The first component is a clear data-entry table. Each row should represent one understandable unit of information, such as one sale, one expense, one customer interaction, one project task, or one business opportunity. Avoid combining multiple transactions into one row because doing so makes filtering and analysis harder.
The second component is a controlled vocabulary. Status fields should use consistent values such as Planned, In Progress, Waiting, Completed, Cancelled, or Overdue. Categories should also be standardized. This prevents the same concept from appearing as “Complete,” “Completed,” “Done,” and “Finished” in different rows.
The third component is time. Dates allow users to filter by day, week, month, quarter, or year. For recurring business reviews, dates are essential because a total without a period can be misleading. A monthly revenue figure means something different from a year-to-date figure.
The fourth component is ownership. Whenever a tracker represents work rather than purely financial transactions, the responsible person or team should be identifiable. Ownership can be especially useful when several people update the same workbook.
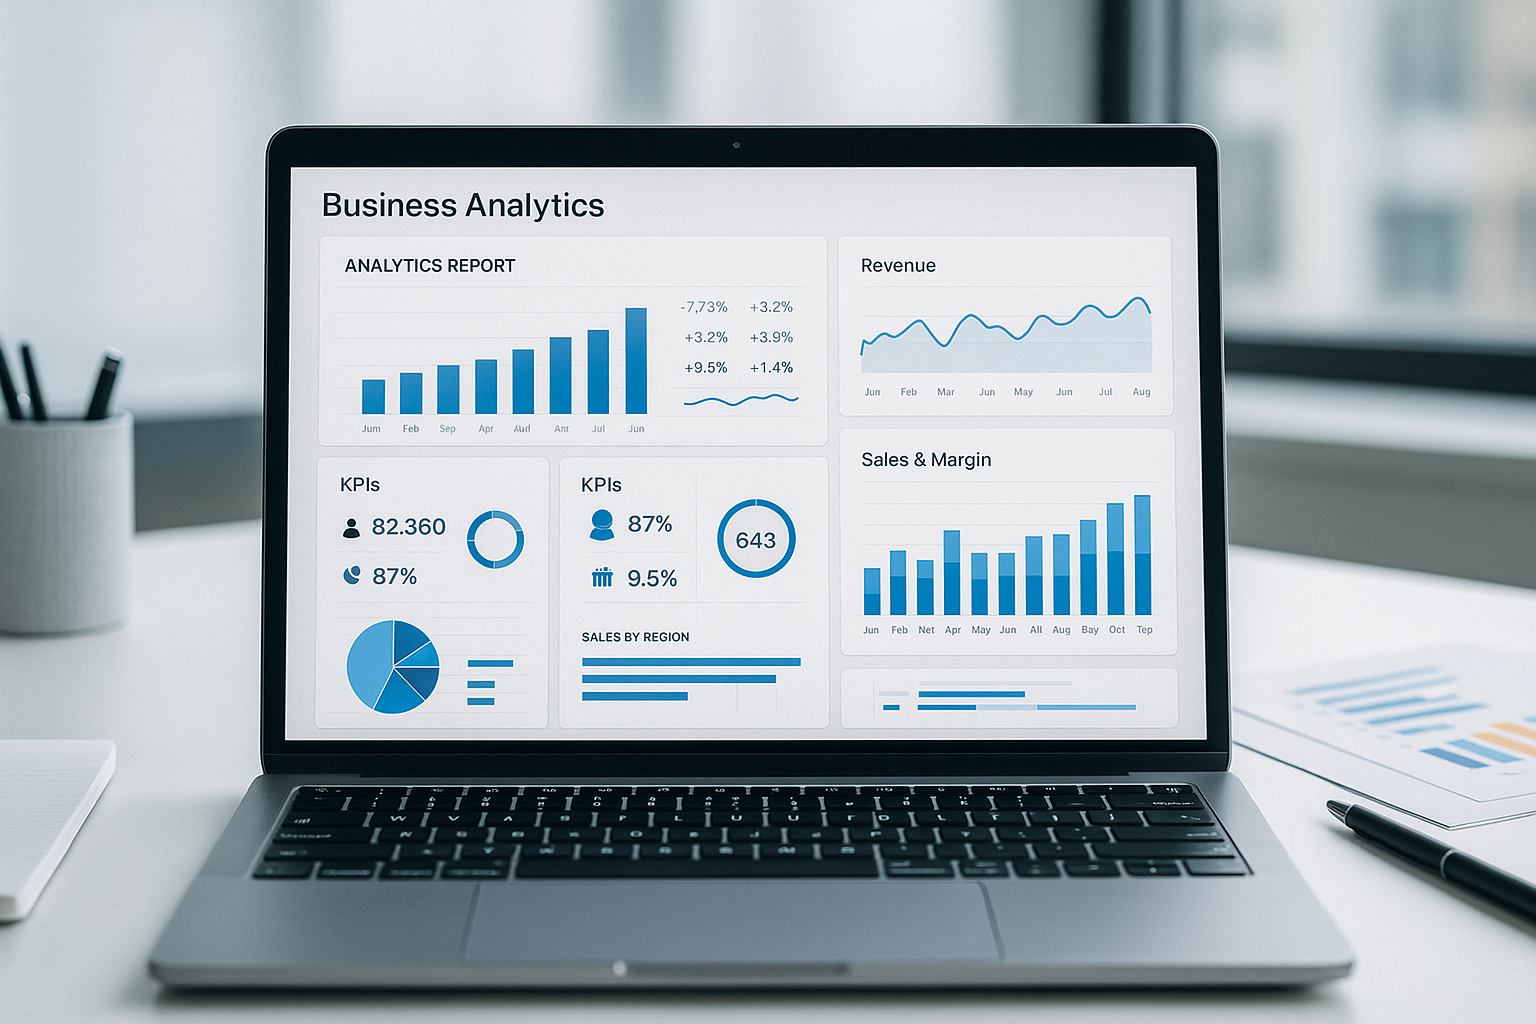
The fifth component is a summary layer. A dashboard does not need to be visually complicated. A few well-selected totals, trends, and exception indicators are often more useful than a page filled with decorative charts.

Choosing the Right Tracking Format
Google Sheets is a natural choice when multiple people need to work in the same workbook from different locations. Its browser-based approach can be convenient for teams that need shared access, comments, and simultaneous editing without exchanging file attachments.
Excel is often preferable when users need sophisticated spreadsheet functionality, offline work, extensive formulas, established financial models, or compatibility with existing business workbooks. Microsoft also offers online Excel templates for business spreadsheets and project trackers, including options that can be customized and shared. :contentReference[oaicite:2]{index=2}
A PDF is different because it is primarily a distribution or presentation format rather than an ideal working database. A tracker may be exported to PDF when a manager, client, lender, or stakeholder needs a fixed report, but the editable source should normally remain in a spreadsheet or another structured system.
Google Docs can be useful for narrative documentation surrounding a tracker. For example, a business might maintain a project tracker in Google Sheets while keeping a project brief, meeting notes, or operating procedure in Google Docs. Smartsheet’s template collections similarly distinguish spreadsheet-oriented resources from Google Docs business documents such as plans, proposals, meeting agendas, and status reports. :contentReference[oaicite:3]{index=3}
The choice should therefore follow the workflow rather than the keyword. If the job involves calculations, filtering, sorting, status changes, and dashboards, a spreadsheet is usually more appropriate than a static document. If the job involves narrative explanation or formal reporting, a document or exported PDF may be more suitable.

Designing the Workbook Structure
A practical workbook can be divided into several logical tabs. One possible structure is Dashboard, Transactions, Sales, Customers, Projects, Expenses, Goals, Lists, and Notes. Not every business needs all of these sheets, but separating major information types can prevent one worksheet from becoming difficult to navigate.
The Dashboard should be the reading layer, not the main data-entry area. Users should enter detailed information in structured tables and allow formulas or pivot-based summaries to produce the dashboard. This separation reduces accidental edits and makes the workbook easier to explain to another person.
The Lists sheet can contain approved status values, categories, departments, owners, sales stages, payment methods, and other controlled fields. Dropdowns can then use those values. This is particularly important in shared spreadsheets because different users often describe the same state differently.
The Notes or Documentation sheet can explain what each column means, how frequently the workbook should be updated, and which formulas should not be overwritten. A short guide can dramatically reduce maintenance problems when the spreadsheet changes hands.
Finally, protect calculation areas where appropriate. Users should generally be encouraged to edit input cells rather than formulas. This is not about making a workbook complicated; it is about reducing the risk that an accidental edit breaks the reporting logic.

Business Metrics Worth Tracking
Financial metrics often form the foundation of a business tracker. Useful fields can include revenue, cost, gross profit, operating expenses, outstanding invoices, cash received, and budget variance. The exact metrics should reflect the business model rather than copying a generic dashboard.
Sales metrics can include opportunities, pipeline value, sales stage, expected close date, actual revenue, average order value, and conversion status. A small service business might care more about proposals and retainers, while an online store may focus on orders, units, refunds, and product margins.
Operational metrics can include order status, inventory levels, supplier activity, delivery deadlines, customer requests, and unresolved issues. These measures help explain why financial performance is changing rather than merely showing the final financial result.
Project metrics can include task status, owner, priority, planned start date, due date, completion percentage, estimated cost, actual cost, and dependencies. Microsoft project-tracking resources specifically emphasize tasks, milestones, owners, deadlines, progress, and roadblocks as common tracker elements. :contentReference[oaicite:4]{index=4}
Strategic metrics can include quarterly objectives, milestones, key initiatives, responsible owners, and current status. The purpose is not to track everything. The purpose is to track information that can change a decision, trigger an action, or reveal whether an objective is moving in the intended direction.
Building an Online Business Tracker Step by Step
Step 1: Define the decisions the tracker must support
Start with decisions rather than columns. Ask what the owner or manager needs to know each week. Examples include whether sales are on target, which invoices require follow-up, which projects are late, which products are profitable, and whether spending is exceeding the plan.
Once the decisions are known, identify the minimum information needed to answer them. This prevents the common mistake of building a massive data-entry table simply because a template contains many fields.
For example, if the objective is to monitor project delivery, the essential fields might be Project, Task, Owner, Priority, Start Date, Due Date, Status, Completion, and Notes. Customer demographic fields would not belong in that table unless they directly support a project decision.
Write the intended review frequency into the design. A daily tracker needs fast entry, while a monthly planning workbook can contain more detailed calculations. A weekly sales review may require a pipeline summary rather than individual activity records.
This first step creates a boundary around the tracker. Without a defined purpose, the workbook tends to become a collection of unrelated lists that are difficult to maintain and almost impossible to analyze reliably.
Step 2: Build the raw-data table
Use one row for one record. If the tracker records sales, one row should represent one sale or one clearly defined sales transaction. If it records projects, one row can represent one task or milestone. This simple rule makes filtering, formulas, and summaries much more reliable.
Use descriptive column names. “Date” is better than “D,” and “Expected Close Date” is better than “ECD” unless the abbreviation is already standard for everyone using the file. Clear headings reduce onboarding time and mistakes.
Keep units consistent. If amounts are stored in one currency, make the currency clear. If quantities are units sold, do not mix units and cases in the same column without an additional unit field. Consistency is more important than visual sophistication.
Separate inputs from calculations. For example, users should enter quantity and unit price, while the workbook calculates line revenue. This reduces duplicated typing and gives the spreadsheet an internal logic that can be checked.
Test the table with realistic sample records before adding a dashboard. If the raw data is difficult to enter or ambiguous, a dashboard will only hide the underlying problem rather than solve it.
Step 3: Add formulas carefully
Formulas should automate repetitive calculations. Common examples include totals, percentages, balances, days remaining, profit, variance, and completion rates. Microsoft notes that Excel templates can use preformatted structures and built-in formulas to reduce setup work. :contentReference[oaicite:5]{index=5}
A formula should have a clear business meaning. For example, budget variance can be defined as Actual minus Budget, while remaining budget can be Budget minus Actual. The direction of the calculation should be documented so users know whether a positive number is favorable or unfavorable.
Avoid excessive formula complexity when a simpler formula produces the same result. Complex nested formulas can become difficult to audit, particularly when a business changes its process later.
Use error handling where it improves readability, especially when a denominator may be zero or a lookup may not find a matching record. However, do not hide genuine data-quality problems with formulas that turn every error into a blank cell.
After adding formulas, test edge cases. Enter a zero, a missing date, a completed task, an overdue task, a refund, a negative amount, and a duplicated record where appropriate. The tracker should respond predictably to unusual but realistic inputs.
Step 4: Add status controls and conditional formatting
Status controls make a tracker easier to scan. A project table might use Planned, In Progress, Blocked, Complete, and Cancelled. A sales pipeline might use Lead, Qualified, Proposal, Negotiation, Won, and Lost.
Do not create too many statuses. If every tiny difference becomes a separate category, the dashboard becomes harder to interpret. A status should communicate a meaningful difference in workflow or decision-making.
Conditional formatting can highlight overdue dates, high-priority work, negative variances, low inventory, or incomplete records. The objective is to make exceptions visible without requiring the reader to inspect every row.
Use visual signals consistently. If red means an urgent problem in one part of the workbook, it should not mean “completed” somewhere else. Consistency reduces the mental effort required to interpret the tracker.
Conditional formatting should supplement good data structure, not replace it. A brightly colored spreadsheet is not necessarily a useful spreadsheet. The underlying fields must still be accurate, consistent, and understandable.
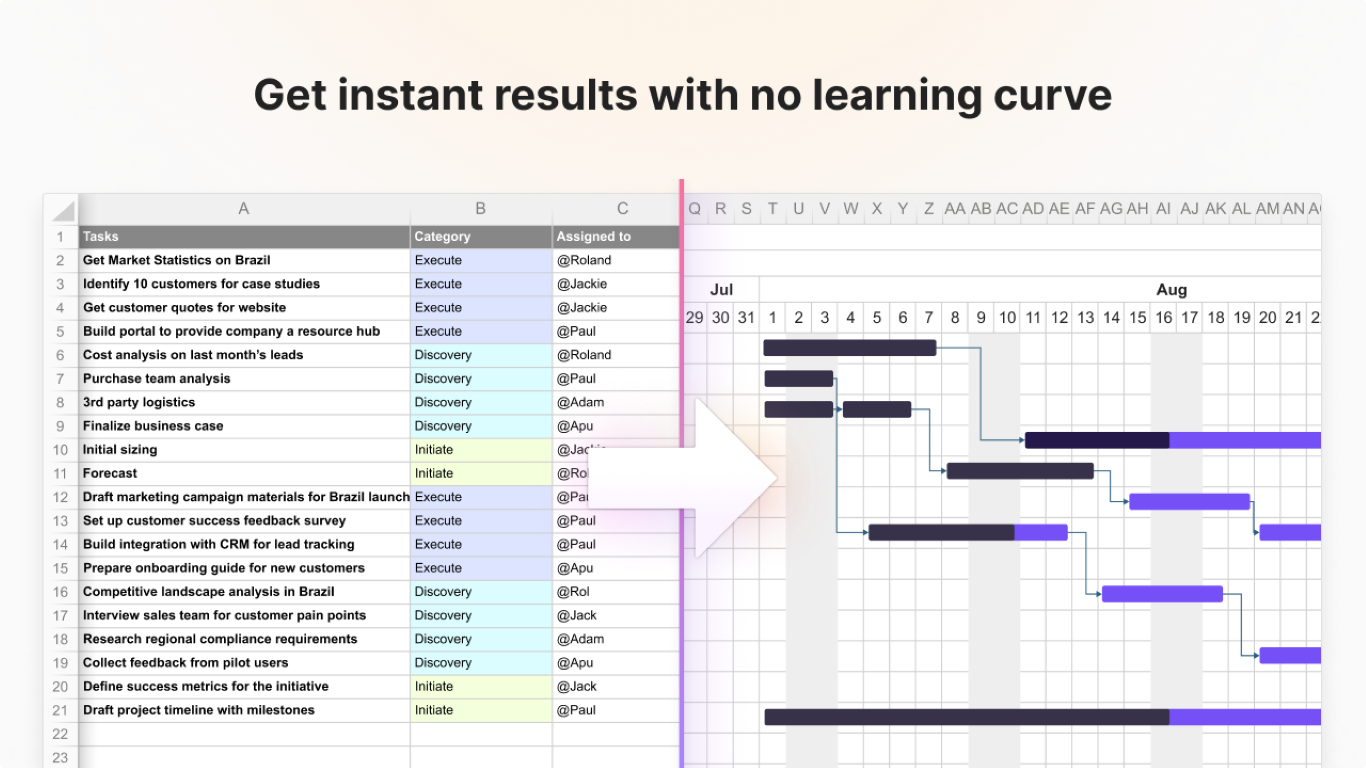
Step 5: Build the dashboard
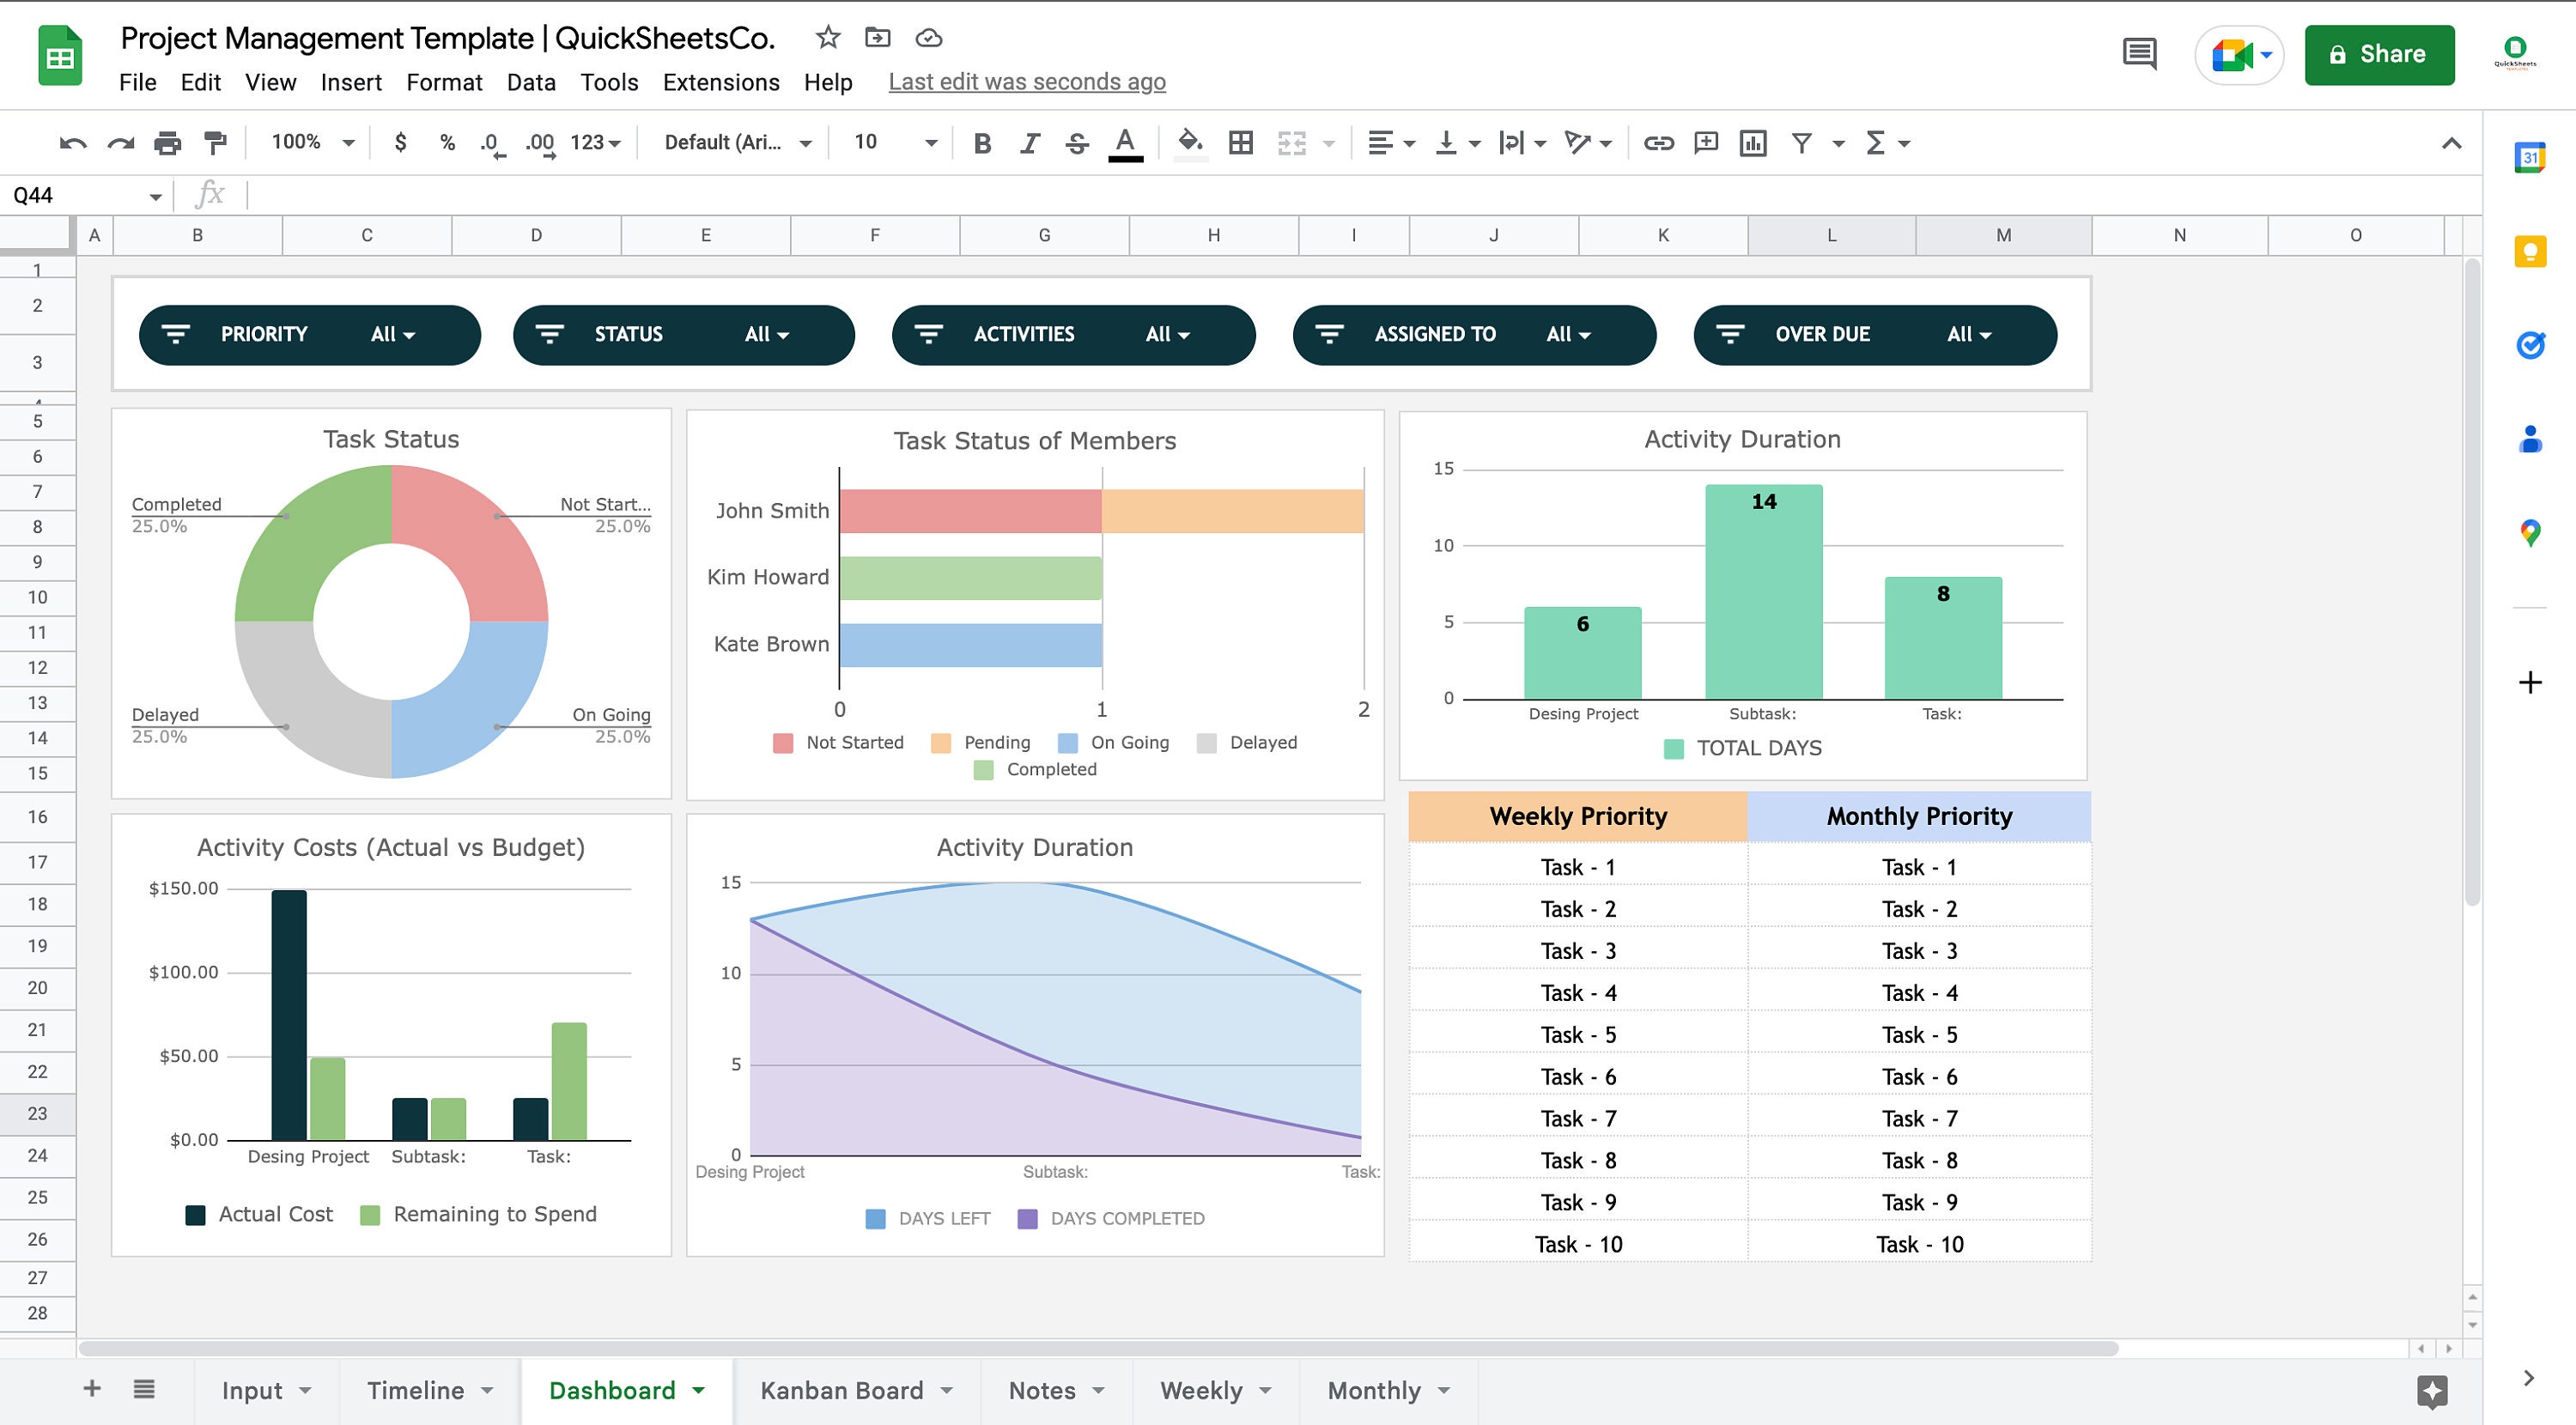
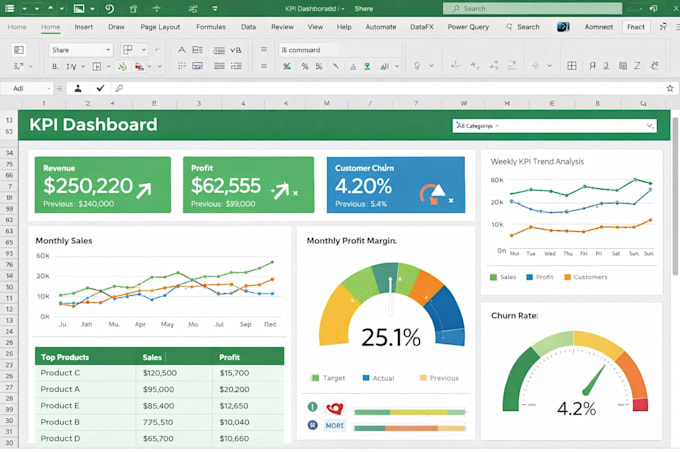
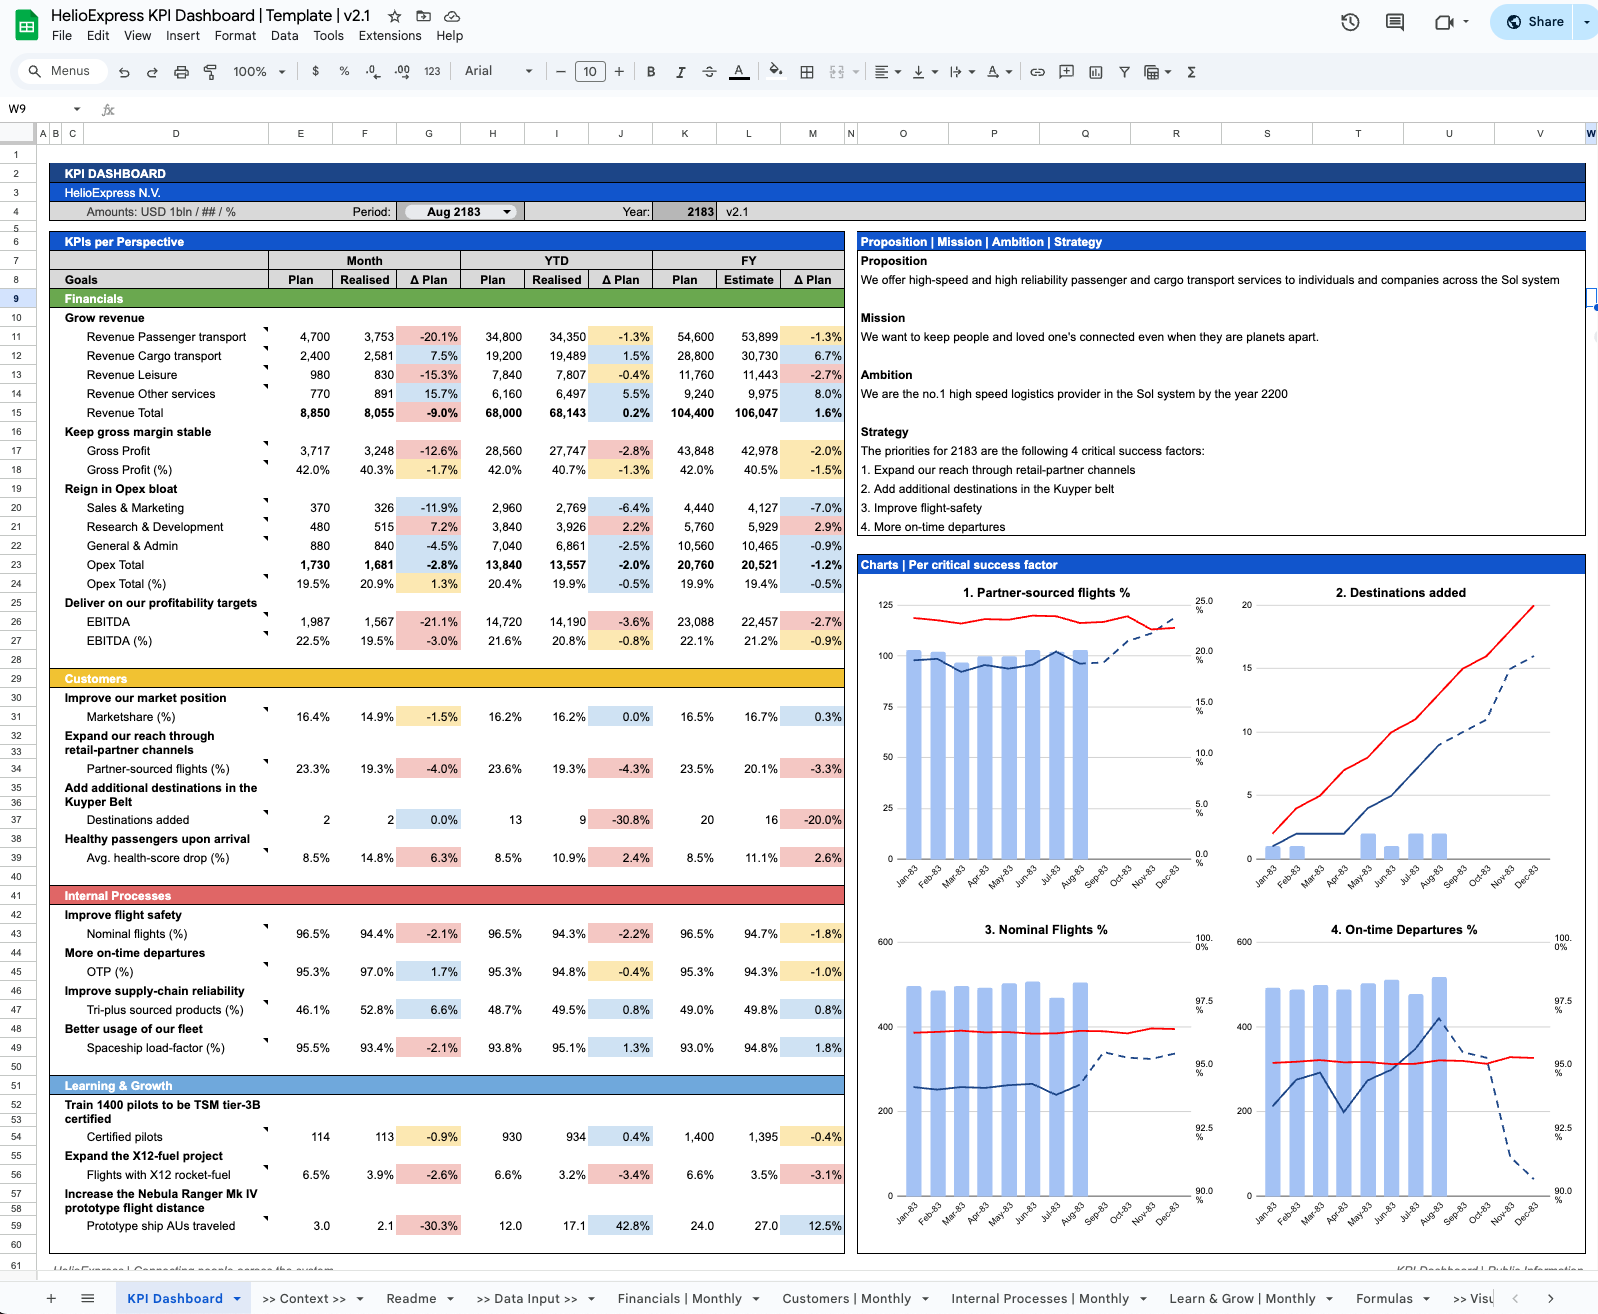
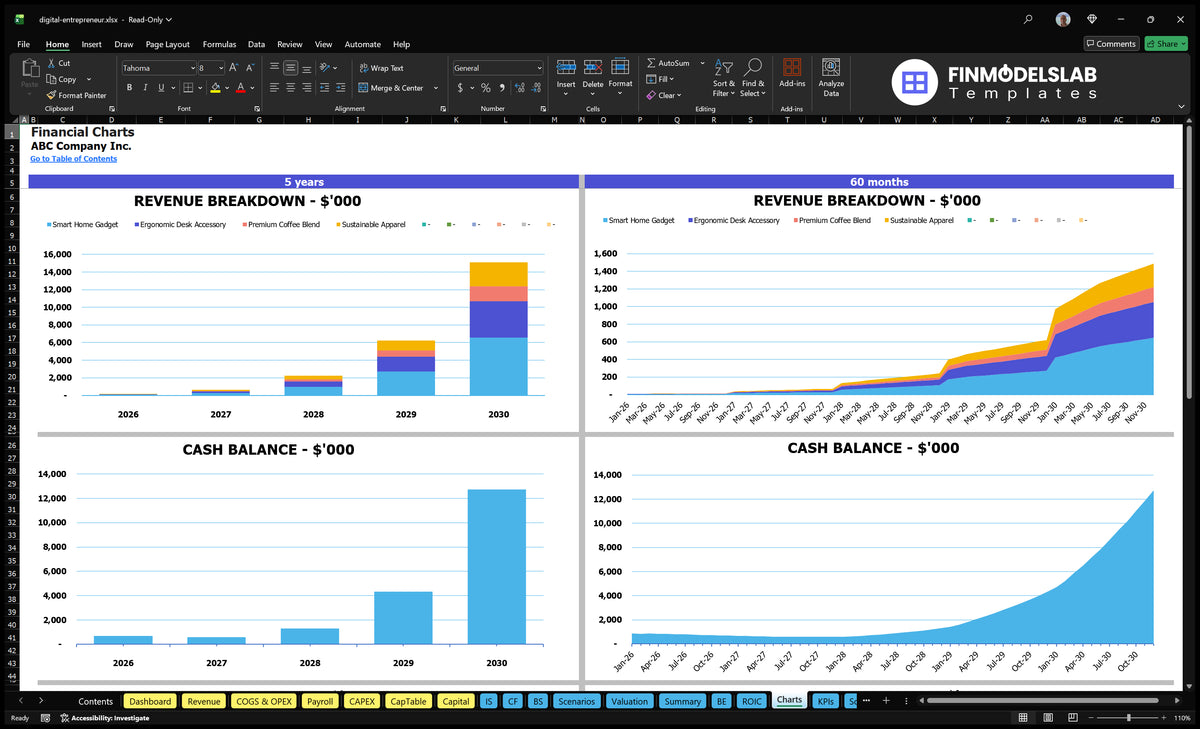
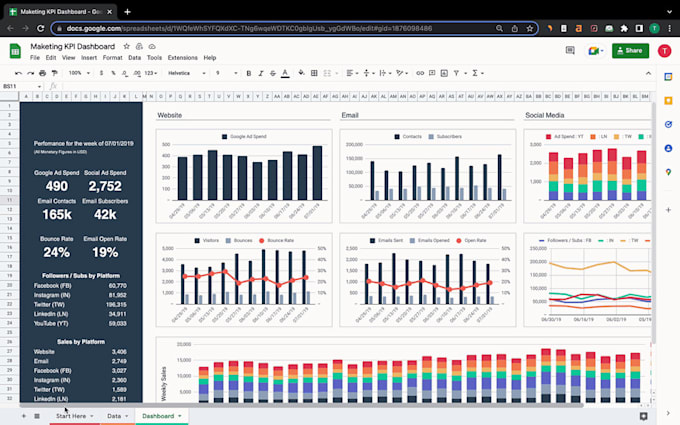
A dashboard should answer the most important questions first. For a general business tracker, a useful top row might contain Revenue, Expenses, Net Result, Open Projects, Overdue Items, and Active Opportunities.
Below the headline metrics, use charts that explain movement. A line chart can show revenue over time, a bar chart can compare categories, and a simple status distribution can show the number of active versus completed items.
Do not use a chart merely because the spreadsheet can create one. Every chart should have a question behind it. If no decision would change after seeing the chart, the chart may not deserve space on the dashboard.
Filters can make dashboards more useful when the dataset is large enough to justify them. Common filters include month, department, product, owner, region, project, and status. Keep the filter choices intuitive and avoid creating a dashboard that requires training just to navigate.
A good dashboard is an entry point to investigation. If an expense category suddenly increases, the user should be able to move from the summary to the underlying records and determine why. A dashboard that cannot be traced back to source data is harder to trust.

Using a Tracker for Sales Management
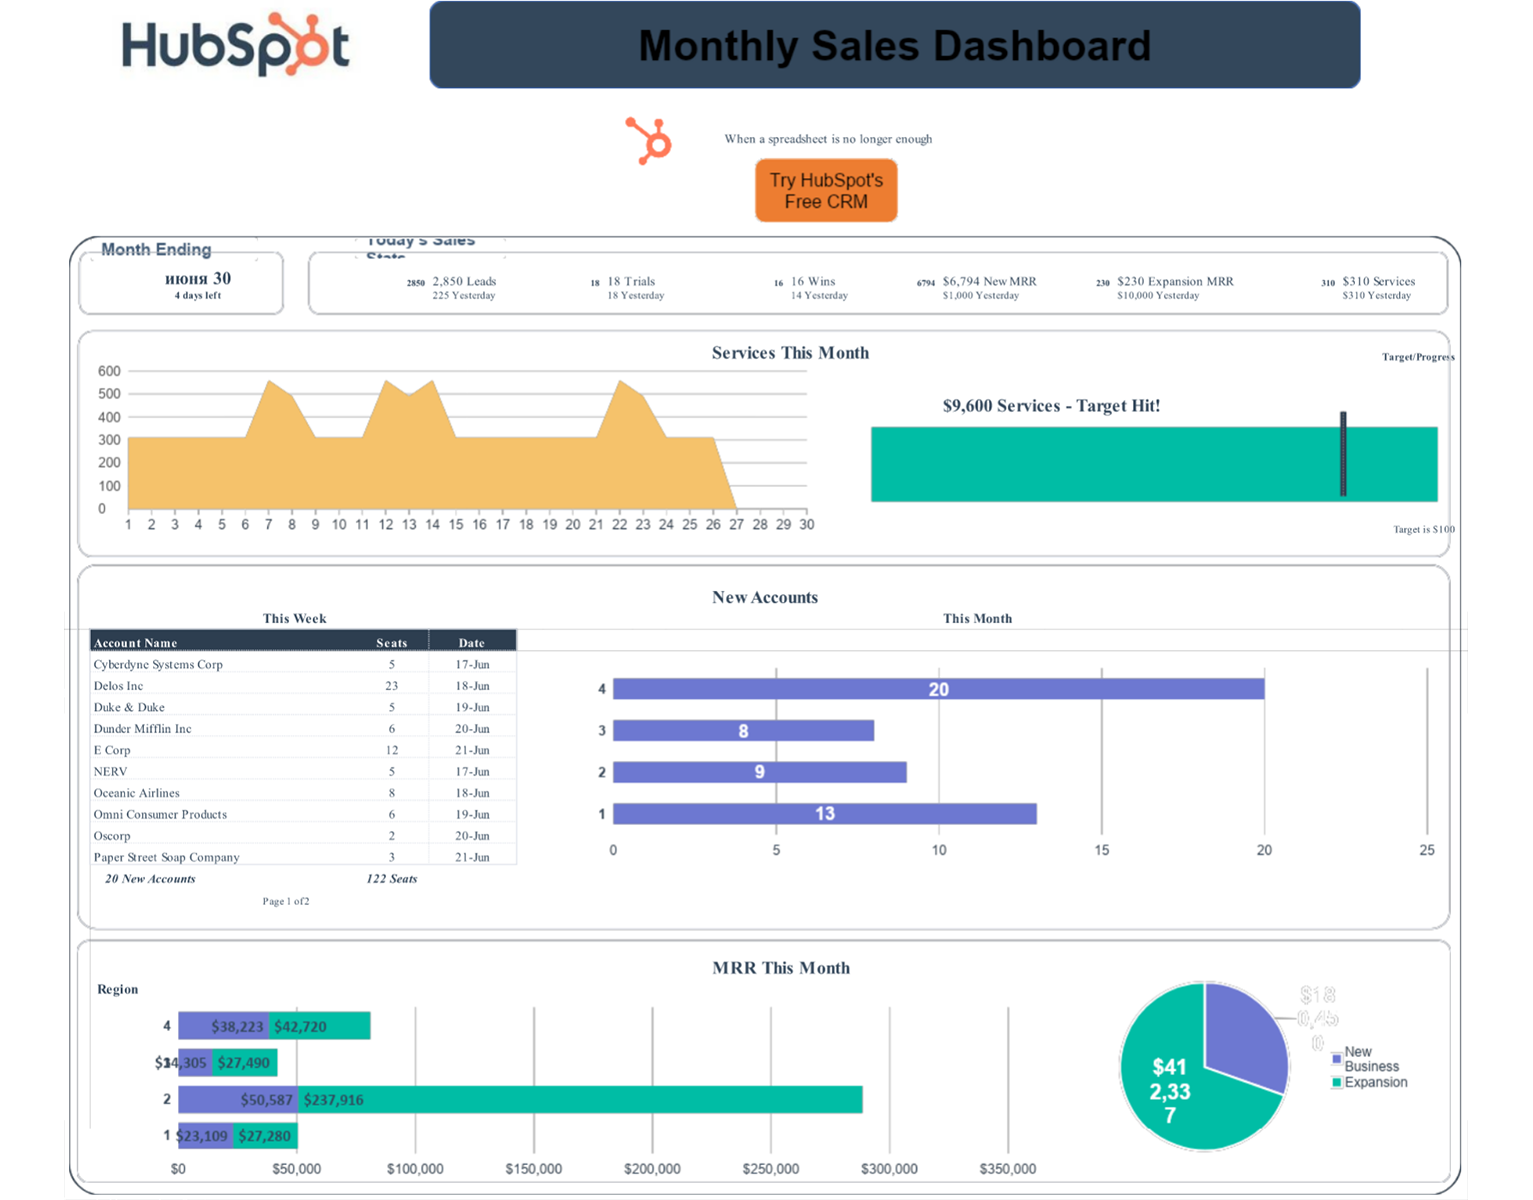
A sales tracker should make the pipeline visible without attempting to become a complete CRM unless that is genuinely required. Useful fields include prospect or customer, opportunity, estimated value, sales stage, probability, owner, next action, expected close date, and outcome.
The next-action field is particularly important. A pipeline full of names and values does not tell the salesperson what to do next. A next-action field turns the tracker into a workflow tool rather than a passive list.
Historical outcomes should also be preserved. When an opportunity is marked Lost, recording a reason can help identify patterns. Possible categories might include price, timing, competitor, lack of need, budget, or no response, provided these categories match the company’s actual sales process.
Sales summaries should distinguish between actual revenue and potential pipeline. A $10,000 closed sale is not equivalent to a $10,000 opportunity that has only entered the pipeline. Mixing those values can create an overly optimistic picture.
Microsoft provides sales-lead and project tracker templates among its broader collection of customizable planning and tracking resources, demonstrating how spreadsheet trackers can be adapted to different business workflows. :contentReference[oaicite:6]{index=6}
Using a Tracker for Projects
A project tracker converts a project plan into an active monitoring system. Instead of only listing the intended work, it records current status, responsibility, deadlines, and exceptions. This makes it useful during weekly project reviews.
A project row might include Project Name, Task, Owner, Priority, Start Date, Due Date, Status, Percentage Complete, Budget, Actual Cost, Dependency, and Notes. The exact fields depend on project complexity.
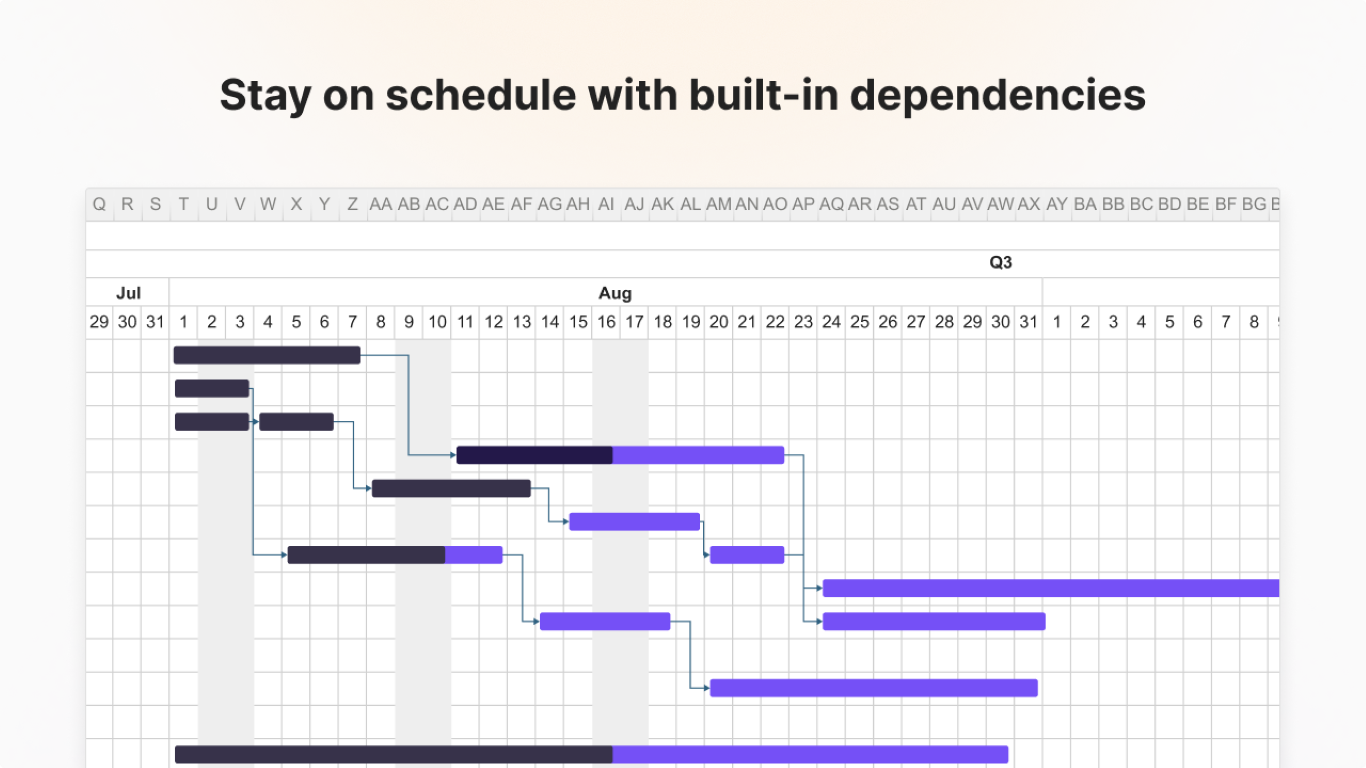
Milestones deserve special treatment because they represent important outcomes rather than ordinary activities. A tracker can use milestone rows or a separate milestone table so that management can see whether major commitments remain on schedule.
Dependencies should be recorded when one task cannot begin until another is completed. This helps explain why an apparently simple delay may affect several later activities. Microsoft describes project timelines and trackers as tools for visualizing milestones, tasks, deadlines, ownership, and progress. :contentReference[oaicite:7]{index=7}
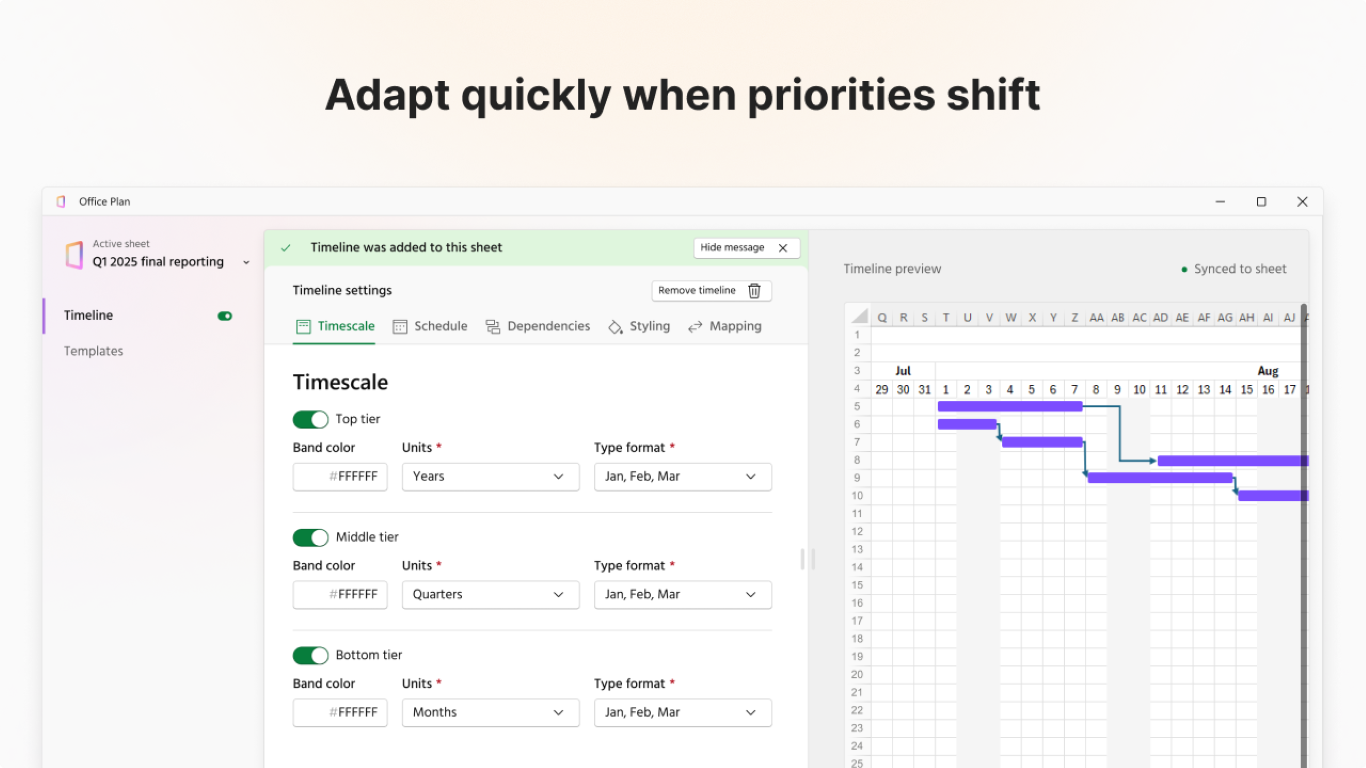
For small teams, a spreadsheet can be sufficient. As project volume and dependency complexity increase, specialized project-management software may eventually become more appropriate. The tracker should therefore solve today’s coordination problem without creating unnecessary administrative work.
Using a Tracker for Financial Control
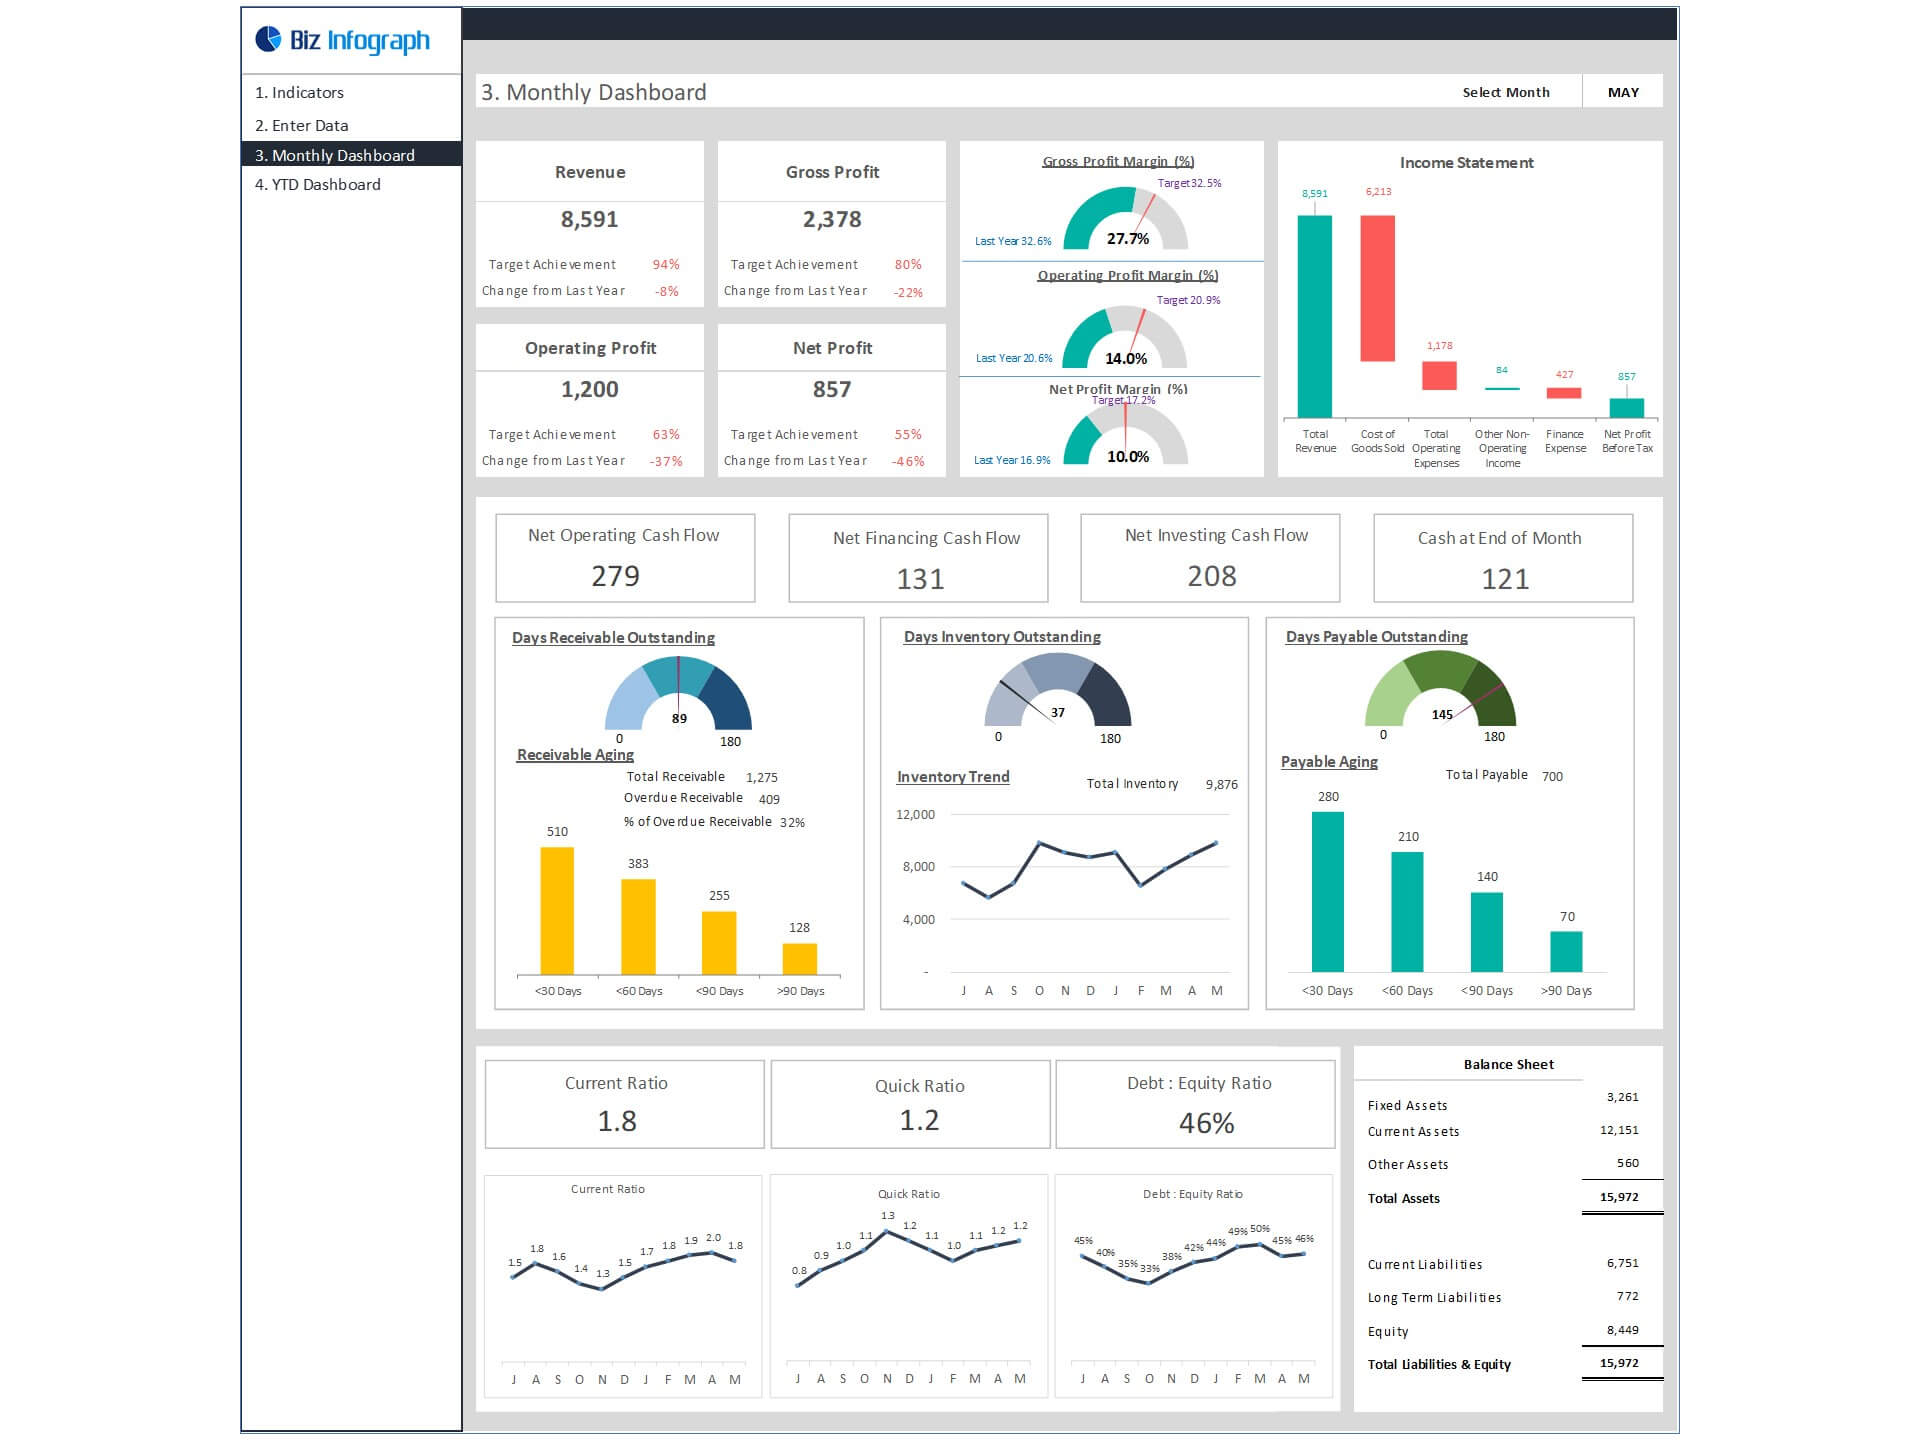
Financial tracking should distinguish between planned, actual, and forecast values. A budget describes what was expected, actuals describe what happened, and a forecast reflects what the business now expects based on current information.
A simple monthly financial tracker can contain revenue, cost of goods sold, operating expenses, taxes or other relevant obligations, and resulting profit. Additional sections can cover accounts receivable, accounts payable, cash balances, and capital spending where appropriate.
Budget variance is often more informative than an isolated expense number. A $5,000 expense may be acceptable if the budget was $7,000, but concerning if the budget was $2,000. The tracker should therefore make the comparison visible.
Cash flow should also be treated separately from profit. A profitable business can still experience cash pressure if customers pay slowly, inventory absorbs cash, or major expenses arrive before revenue is collected. Cash-flow statements traditionally separate operating, investing, and financing activities.
Templates from Microsoft and Smartsheet show common spreadsheet approaches to budgets, forecasts, variance analysis, financial dashboards, and cash-flow planning. These resources illustrate the usefulness of combining structured financial tables with visual summaries rather than relying only on raw transaction lists. :contentReference[oaicite:9]{index=9}
Using a Tracker for Business Development
Business development tracking focuses on future opportunities rather than only completed transactions. It can include partnerships, leads, proposals, strategic accounts, market opportunities, channel discussions, and expansion projects.
The most important distinction is between an opportunity and an activity. An opportunity represents a potential business outcome, while an activity is something the team does to move that opportunity forward. Tracking both creates a clearer picture of progress.
For example, a partnership opportunity might contain Target Organization, Opportunity Type, Potential Value, Stage, Owner, Next Action, Expected Decision Date, and Risk. A separate activity log could record meetings, emails, proposals, and follow-ups.
Business development templates should not encourage inflated pipeline numbers. A potential opportunity should have a defined stage and a realistic method for estimating its value. If the value is uncertain, the tracker can record a range or qualitative confidence level rather than presenting an unsupported exact figure.
The result is a more disciplined development process. Managers can see which opportunities are progressing, which are stalled, and where the team is spending effort without corresponding movement.

Google Sheets Versus Excel for Business Tracking
Google Sheets is especially useful for collaborative workflows. Multiple people can work from the same cloud document, which can reduce version-control problems caused by sending revised spreadsheet files by email.
Excel is especially strong when a business already depends on Excel-based financial models, advanced spreadsheet functions, desktop workflows, or established reporting processes. Microsoft also provides web-based Excel templates that can be customized, shared, printed, or exported. :contentReference[oaicite:10]{index=10}
There is no universal winner. A two-person online business may prefer Google Sheets because collaboration is more important than advanced workbook functionality. An analyst maintaining a complex financial model may prefer Excel because of existing formulas, models, and reporting conventions.
Compatibility should also be tested before adopting a template. Some Excel features may behave differently after conversion to another spreadsheet environment. Before moving a business-critical tracker, test formulas, dropdowns, charts, date calculations, filters, and print settings.
The best choice is the platform that the intended users will actually update correctly. A technically powerful tracker is not useful if the team avoids it because access, navigation, or maintenance is inconvenient.

How to Keep Data Clean
Data quality is one of the biggest determinants of tracker usefulness. A dashboard cannot compensate for inconsistent source records. Before analyzing results, make sure dates, categories, amounts, statuses, and identifiers follow consistent rules.
Duplicate records should be detected early. If the same sale appears twice, revenue totals may become inflated. A unique transaction ID, order number, invoice number, or combination of date and reference fields can help identify duplicates.
Blank values should be interpreted carefully. A blank amount may mean zero, missing information, or an entry that has not yet been completed. These meanings should not be mixed. Where possible, use explicit values such as 0 or Not Available when the distinction matters.
Data validation can reduce typing errors. Dropdown lists are useful for status, category, department, owner, payment method, and similar controlled fields. The lists should be reviewed periodically because business processes change.
Finally, keep a change history or versioning process for important workbooks. If a formula is accidentally altered, the business should have a way to identify what changed and restore a reliable version.
Data Collection and Review Workflow
A reliable tracker follows a repeatable workflow: capture, validate, summarize, review, and act. Capture means entering the source event as close to the time of occurrence as practical. Delayed entry increases the chance of forgotten or incomplete records.
Validation means checking whether the record contains the required fields and uses approved values. Automated checks can flag missing owners, invalid dates, negative quantities, or overdue actions.
Summarization turns records into information. This can be done through formulas, pivot tables, charts, or dashboard calculations. The summary should preserve enough detail to allow the user to investigate unusual results.
Review means looking at the information on a consistent schedule. A sales tracker might be reviewed weekly, while a budget may receive a monthly formal review and a more frequent cash check. The frequency should match how quickly the underlying business changes.
Action closes the loop. If a dashboard identifies overdue invoices, someone needs to contact the relevant customer. If a project is delayed, the owner needs a recovery plan. If spending exceeds budget, management needs to decide whether to reduce spending, revise the forecast, or accept the variance.
Practical Examples
Example: Online service business
Imagine a small design studio with five active clients. Its tracker could contain a client directory, project tracker, invoice tracker, expense log, and monthly dashboard. Each project record identifies the client, service, owner, deadline, status, invoiced amount, amount paid, and outstanding balance.
The weekly dashboard could show active projects, projects due within seven days, overdue tasks, invoices outstanding, monthly revenue, and current expenses. These figures would give the owner a compact view of both delivery and cash collection.
The important feature is the connection between operational and financial data. A project marked complete should trigger an invoice review, while an unpaid invoice should appear in a receivables review. The tracker therefore becomes a workflow rather than a collection of unrelated spreadsheets.
The business could later add customer acquisition, recurring revenue, project profitability, and capacity planning. Those additions should be made only when the business has a clear question that the new data will answer.
This example demonstrates why an online business tracker template should be customizable. The underlying framework remains consistent, but the fields and dashboards should reflect how the actual business earns money and delivers work.

Example: Small online store
An online store might use a sales and inventory tracker with fields for order date, order ID, customer, product, quantity, selling price, product cost, shipping, discount, refund, payment status, and fulfillment status.
From those records, the business could summarize revenue by product, units sold by month, gross margin, orders awaiting fulfillment, refunds, and inventory that is approaching a reorder threshold.
The store should avoid calculating profit from revenue alone. Product costs, transaction fees, advertising costs, shipping, refunds, and other relevant costs may affect the true result. The tracker should clearly define which costs are included in each profitability measure.
A product-performance dashboard can then identify which products sell frequently, which produce stronger margins, and which consume inventory without generating sufficient returns. This information can support purchasing and promotional decisions.
For businesses selling across several channels, a Channel field can separate website, marketplace, social commerce, wholesale, or other sources. The same sales table can then support comparisons without requiring separate spreadsheets for every channel.
Common Mistakes to Avoid
The first mistake is tracking too much. Every additional field creates maintenance work. If nobody uses a field for a decision, it probably does not belong in the main tracker.
The second mistake is mixing data and presentation. A table should be optimized for reliable records, while a dashboard should be optimized for reading. Trying to make one sheet perform both jobs often creates clutter.
The third mistake is using inconsistent categories. If one person records “Social Media,” another enters “Social,” and another enters “Social marketing,” the resulting summaries may split one category into three.
The fourth mistake is failing to define calculations. A metric such as “profit” can have several meanings depending on which costs are included. Every important KPI should have a clear definition that users understand.
The fifth mistake is not scheduling maintenance. A tracker without a review rhythm gradually becomes stale. Assign responsibility for data entry, define the expected update frequency, and establish a short recurring review process.
Best Practices for Professional Use
Keep the data-entry experience simple. Use frozen headings, sensible column order, dropdowns, clear date formats, and consistent number formats. A user should not have to search through a complicated layout to record a routine transaction.
Separate raw data from reporting. This makes it easier to replace, clean, or expand the source records without rebuilding every visual component.
Use a single source of truth wherever possible. If revenue appears in three different sheets, avoid manually typing it three times. Link the reporting sheets to one authoritative transaction table.
Document definitions. If “active customer” means a customer with a transaction within the last 90 days, write that definition down. If “overdue” means the due date has passed and the status is not Complete, document that rule as well.
Back up important files. Cloud version history can help, but critical business information should still have an appropriate backup and access-control strategy.
Review permissions. Shared spreadsheets may contain commercially sensitive information. Give people the access they need for their role and avoid unnecessarily exposing financial or customer information.
Keep historical periods stable. If a business changes its category definitions, preserve the original data and document the change rather than silently rewriting historical information. This makes year-over-year comparisons more defensible.
Finally, design for the person who will maintain the workbook, not only the person who designed it. A tracker is successful when another user can understand it, update it, and explain its results without depending on the original creator.
Practical Solution: Build a Simple Business Tracking System
The most practical solution for a small business is to begin with a compact tracker and expand only when the workflow proves the need. Start with five core areas: Transactions, Sales or Orders, Projects or Tasks, Expenses, and Dashboard.
In the Transactions sheet, record every financial event with a date, reference, category, description, amount, and status. Keep the table chronological and avoid merged cells. This becomes the source for financial summaries.
In the Sales or Orders sheet, record customer, product or service, quantity, value, sales stage or fulfillment stage, payment status, and next action. This sheet should answer what has been sold, what is pending, and what requires follow-up.
In the Projects or Tasks sheet, record the work required to deliver the business’s commitments. Include owner, priority, due date, status, and completion. If a project has many tasks, group them by project ID.
In the Expenses sheet, record spending consistently by date, category, supplier, amount, payment method, and notes. Separate planned spending from actual spending if budget control is important.
Finally, create a Dashboard with only the indicators that matter. A simple starting dashboard might contain monthly revenue, monthly expenses, net result, open sales opportunities, overdue tasks, outstanding invoices, and a short list of the most urgent actions.
Review the tracker once a week. First check data quality, then financial performance, then sales, then operations, and finally strategic priorities. The sequence turns the tracker into a repeatable management meeting rather than a passive reporting document.
Every month, archive or preserve the relevant period, review category definitions, check formulas, and remove obsolete workflow fields. Every quarter, reconsider whether the dashboard still reflects the questions management needs to answer.
This approach provides a practical balance between simplicity and visibility. It also creates a path toward more sophisticated systems without forcing a small business to implement complex software before its processes are ready.
Reference Examples
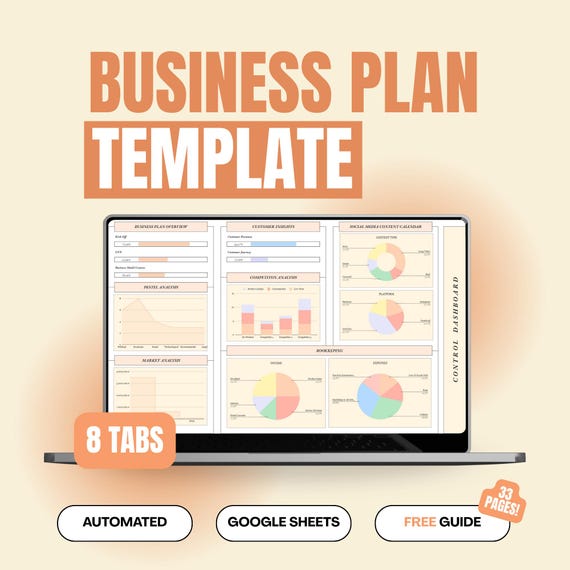
The following examples illustrate different visual approaches to business tracking, including dashboards, sales records, business plans, opportunity tracking, and spreadsheet-based financial management. They are examples for visual reference rather than endorsements or claims that every depicted template is free or appropriate for every business.
online business tracker template google sheets
Source: Etsy
online business tracker template excel

Source: Hotmart
online business tracker template free
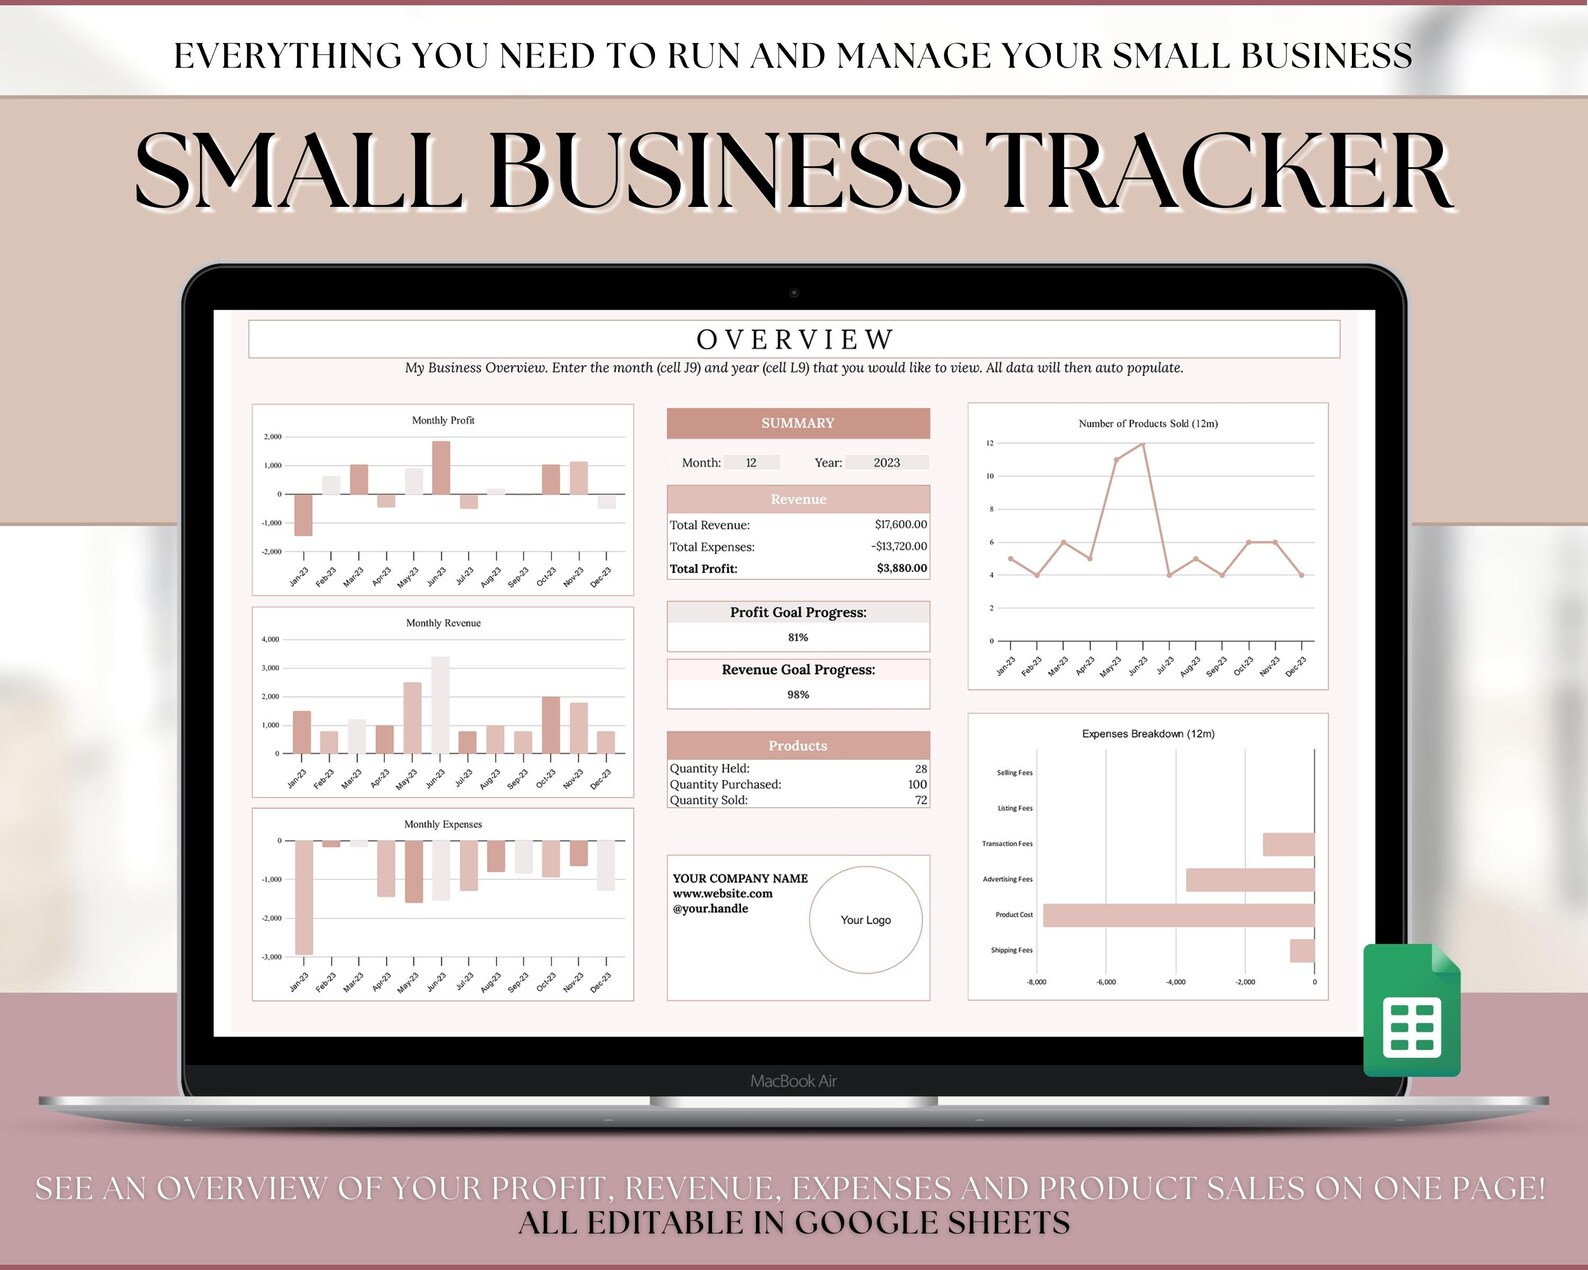
Source: Etsy
online business tracker template free download
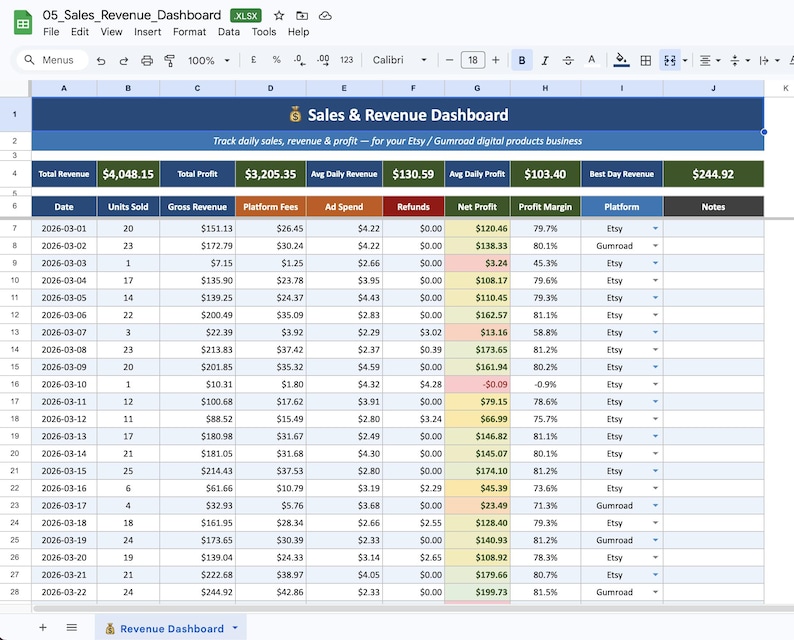
Source: Etsy
online business tracker template excel free

Source: Hello Digital Co
online business tracker template google docs
Source: Obsidian Publish
online business tracker template pdf

Source: Modeles de Business Plan
business tracker excel template
Source: Financial Models Lab
business sales tracker template
Source: Fiverr
business development tracker template

Source: Pinterest
business project tracker template
Source: Etsy
downloadable business plan tracker
Source: Shawbrook
Frequently Asked Questions
What is the main purpose of an online business tracker template?
The main purpose is to organize recurring business information so that users can monitor progress, compare results, identify exceptions, and decide what action to take. A good tracker connects daily records with useful summaries instead of simply storing information.
Should a small business use Google Sheets or Excel?
Either can work well. Google Sheets is convenient for browser-based collaboration, while Excel is particularly useful for businesses that depend on established Excel workbooks, advanced calculations, or desktop spreadsheet workflows. The best choice depends on the users and the complexity of the work.
What should an online business tracker include?
A general tracker may include dates, categories, amounts, statuses, owners, deadlines, references, notes, and calculated metrics. The exact structure should be based on the decisions the business needs to make rather than on a generic list of fields.
Can a business tracker monitor sales?
Yes. A sales tracker can record customers, opportunities, products or services, values, stages, expected dates, owners, next actions, and outcomes. A dashboard can then summarize pipeline, closed sales, conversion activity, and other relevant measures.
Can a business tracker be used for projects?
Yes. Project trackers commonly include tasks, owners, priorities, deadlines, status, milestones, dependencies, and completion percentages. Microsoft provides project tracker and timeline templates designed for this type of workflow. :contentReference[oaicite:11]{index=11}
Can an Excel tracker be shared online?
Yes. Modern Excel workflows support online sharing and collaboration, and Microsoft provides business spreadsheet resources designed for online use. A shared workbook should still use clear permissions and a consistent process for editing important data. :contentReference[oaicite:12]{index=12}
Can a tracker be exported as a PDF?
Yes. A spreadsheet can often be formatted and exported as a PDF for distribution or reporting. Microsoft specifically describes saving, printing, and sharing planner and tracker templates as PDF as part of common spreadsheet workflows. :contentReference[oaicite:13]{index=13}
How often should a business tracker be updated?
The correct frequency depends on the information. Sales activity may require frequent updates, project status may be reviewed weekly, and formal budget analysis may occur monthly. The important point is to establish a predictable routine that keeps the information current enough to support decisions.
What is the biggest mistake when creating a tracker?
One of the biggest mistakes is building a complicated workbook without defining its purpose. If the tracker requires too much manual work or collects information nobody uses, people will stop maintaining it. Start with essential fields and add complexity only when there is a clear benefit.
When should a business move beyond a spreadsheet?
A spreadsheet may become unsuitable when transaction volume, concurrent users, automation requirements, permissions, integrations, audit requirements, or workflow complexity become difficult to manage reliably. The decision should be based on operational needs rather than simply on the size of the business.
Conclusion
An online business tracker template is most valuable when it turns scattered business activity into a clear, repeatable management process. Whether the workbook is used for sales, expenses, projects, business development, inventory, customers, or strategic goals, the same principles apply: define the decisions first, structure the source data carefully, automate repetitive calculations, keep categories consistent, and review the information on a predictable schedule. A simple tracker that remains accurate and useful is far more valuable than an impressive dashboard that nobody maintains. I can also create an image explaining the complete business-tracking workflow from data entry to dashboard decisions.
