A strong marketing pr metrics and evaluation Template should do more than collect numbers. It should help a marketing or public relations team explain what was planned, what was delivered, how audiences responded, and whether communication activity contributed to meaningful organizational results. The most useful structure connects objectives, audiences, activities, outputs, audience responses, outcomes, and business impact instead of treating every available metric as equally important.
Modern PR measurement increasingly follows this logic. AMEC’s Integrated Evaluation Framework separates objectives, inputs, activities, outputs, out-takes, outcomes, and impact, while its taxonomy emphasizes that metrics should be selected according to the stage being evaluated. This distinction prevents a high number of media mentions, impressions, or social interactions from being presented as proof of changed awareness, behavior, reputation, or commercial performance.
For marketers, the practical challenge is turning that framework into a repeatable reporting structure. A useful template should therefore contain fields for the objective, KPI definition, baseline, target, reporting period, data source, actual result, variance, interpretation, and next action. That structure makes the report easier to audit and much more useful during monthly, quarterly, and campaign reviews.

What a marketing PR metrics and evaluation Template should accomplish
The first purpose of the template is alignment. Before selecting metrics, define what the communication program is expected to achieve. A campaign intended to increase awareness needs a different evaluation design from one intended to generate qualified inquiries, improve reputation, support a product launch, or influence an existing audience’s behavior. The KPI should follow the objective rather than the other way around.
The second purpose is consistency. If a team changes its definition of media coverage, reach, engagement, sentiment, or conversion every reporting period, comparisons become unreliable. A well-designed template records the metric definition and measurement method so that the same calculation can be repeated. It should also identify the reporting period and any benchmark used for comparison.
The third purpose is decision-making. A report should not stop at stating that a number increased or decreased. It should explain what changed, why the change may have occurred, what evidence supports that interpretation, and what the team should do next. AMEC describes meaningful evaluation as an evidence-based story that connects communication activity with audience response and organizational outcomes.
Start with objectives rather than available data
A common reporting mistake is beginning with whatever data a monitoring system happens to provide. That approach encourages teams to report easy-to-count indicators even when those indicators have little connection with the campaign’s purpose. Instead, write the communication objective first and then determine what evidence would demonstrate progress.
Objectives should be specific enough to evaluate. For example, an illustrative objective might be to increase qualified awareness among a defined audience during a three-month product launch. The corresponding measurement plan could include quality-weighted media coverage, message penetration, branded search behavior, referral traffic, and a suitable audience research measure. The numbers in this example are hypothetical; the important point is the relationship between objective and evidence.
When objectives are clear, the template can include a simple chain: objective, target audience, strategy, activity, output, audience response, outcome, business indicator, and decision. This creates a logical connection between communication work and evaluation. It also makes stakeholder conversations easier because executives can see why each KPI is present.

The six measurement layers to include
A practical template can organize measurement into six layers: objectives, inputs, activities, outputs, audience responses and outcomes, and organizational impact. This structure is closely aligned with the AMEC evaluation taxonomy. Not every campaign will have strong evidence at every layer, but the structure helps the team identify where evidence exists and where measurement needs improvement.
Objectives describe what success means. Inputs capture resources such as budget, research, people, partnerships, and planned benchmarks. Activities describe what the team actually did, such as media relations, content production, events, influencer outreach, executive communication, or stakeholder engagement.
Outputs describe what was produced or published. Examples include media placements, press releases, published articles, posts, events, or pieces of content. Out-takes and outcomes move closer to audience response, including awareness, understanding, engagement, trust, preference, intention, advocacy, or behavior. Impact considers broader organizational effects such as reputation, relationships, demand, qualified leads, retention, or other business indicators where a defensible connection can be established.

This layered structure is particularly useful when building a marketing reporting metrics template because it prevents output measures from being confused with outcomes. Ten published stories are evidence of coverage activity; they are not automatically evidence that ten customers changed their behavior. Similarly, a large potential audience does not prove that the intended audience noticed, understood, trusted, or acted on the message.

Core PR and marketing metrics worth considering
Media coverage volume is useful when interpreted as an output. It can reveal whether a campaign generated the amount of attention expected and can provide a baseline for comparison. However, volume alone says little about the quality, relevance, credibility, prominence, message accuracy, or audience fit of the coverage.
Share of voice can add competitive context by comparing a brand’s coverage with a defined competitor set. The template should document the competitors included, time period, channels, search criteria, geographic scope, and deduplication method. Without these definitions, two share-of-voice calculations may look comparable while actually measuring different things.
Reach and impressions can help estimate exposure, but they should be treated as exposure indicators rather than direct evidence of influence. Cision’s example illustrates why coverage volume and potential audience reach can move differently: a smaller number of placements in large outlets can create a different exposure pattern from a high volume of smaller placements.

Sentiment is another useful dimension, particularly when reputation or perception is part of the objective. A template should identify whether sentiment is manually coded, algorithmically classified, or evaluated through another methodology. Automated sentiment can be useful for scale, but important campaigns may require human review because context, irony, quotation, and complex language can affect classification.
Message penetration measures whether important messages actually appear in coverage or audience conversations. This is often more informative than counting coverage alone. If a campaign is designed to establish three strategic ideas, the report can record how often each idea appears and whether it appears accurately, prominently, and in the intended context.
Website referral traffic, engagement, qualified inquiries, and conversions can connect PR exposure with owned-channel behavior. Attribution must be handled carefully because users may encounter several touchpoints before taking action. Where possible, use tracking parameters, referral information, campaign identifiers, CRM records, or controlled comparisons to strengthen the evidence rather than claiming that every conversion resulted from one communication activity.
Because the image above is already used as a main visual, it should not be repeated. A published template should likewise avoid duplicating the same chart merely because several stakeholders want to see it. A better approach is to maintain one authoritative metric and provide different interpretations for different audiences.

Building a reliable KPI structure
A KPI should have a precise name and definition. “Engagement” is too broad by itself because it might mean reactions, comments, shares, clicks, video completion, time on page, or another action. The template should state exactly what is counted, which channels are included, and whether the metric is a rate, total, average, or indexed measure.
The next field should identify the baseline. A target without a baseline can be difficult to interpret. If a campaign target is to increase positive coverage, the team needs to know the starting level and the period against which the change will be evaluated. Baselines may come from previous periods, historical campaign averages, competitor comparisons, research, or another justified reference point.
Targets should also reflect the nature of the objective. Some indicators are naturally directional, while others require a minimum threshold. For example, a crisis-management program may prioritize reducing negative coverage or shortening response time, whereas a product-launch program may emphasize relevant reach, message penetration, referral traffic, and qualified demand.

Use variance to make reports easier to interpret
Variance is one of the most useful fields in a recurring evaluation report. It can show actual performance against a target, previous period, previous year, or benchmark. A simple variance field should also indicate whether a positive change is desirable. Higher coverage may be positive in one context but harmful during an issue-management situation if the additional coverage is negative.
The report should therefore combine numerical variance with interpretation. A hypothetical example might state that relevant coverage increased while message penetration declined. The interpretation would not simply call the campaign successful because the volume rose. Instead, the team would investigate whether the larger volume came from low-relevance outlets, whether the key narrative was diluted, and whether the audience most important to the objective actually responded.
This is where a marketing metrics report template becomes more valuable than a basic activity log. The report can contain columns for KPI, definition, source, baseline, target, actual, variance, interpretation, confidence level, and recommended action. Such a structure turns reporting into an ongoing management process rather than a retrospective collection of statistics.
How to evaluate media quality
Media quality should be evaluated against the campaign’s audience and strategic purpose. A highly authoritative outlet may be valuable for one campaign but less relevant for another if its audience does not match the target group. A niche publication can sometimes be more strategically useful than a large general outlet when the objective is industry credibility or specialist demand.
A practical scorecard can therefore record outlet category, relevance, geographic fit, audience fit, prominence, message inclusion, sentiment, backlink presence where relevant, and whether the article is original coverage or substantially reproduces supplied material. The scoring method should be documented so that the same criteria are applied consistently across reporting periods.
Qualitative review remains important. Two articles can contain the same number of brand mentions but have very different communication value because one provides detailed context and accurate key messages while the other contains a brief reference with little relevance. A good evaluation template gives reviewers a place to record that difference.

Connecting PR metrics with marketing outcomes
PR rarely operates in isolation. Earned media can influence website discovery, search behavior, consideration, referrals, social conversations, stakeholder confidence, and other marketing signals. A strong evaluation model therefore connects communication evidence with relevant downstream indicators without claiming causation that the available data cannot support.
One practical approach is to establish a campaign identifier and monitor traffic, inquiries, leads, or other relevant actions during the campaign window. Compare those indicators with a baseline or suitable comparison period. Where the evidence is observational rather than experimental, describe the relationship as an association or contribution rather than definitive causation.
Another approach is triangulation. Combine media coverage data with web analytics, customer research, brand tracking, CRM records, survey results, and qualitative evidence. If several independent sources point toward the same change, the evaluation story becomes more credible than a conclusion based on a single metric.

Business impact should also be evaluated over an appropriate time horizon. Some communication objectives can show short-term responses, while reputation, trust, relationships, or organizational change may take longer. AMEC notes that not every evaluation can demonstrate long-term impact immediately, so the reporting cadence should match the expected pathway from communication to result.
Choosing the right reporting format
An Excel-oriented structure is useful when the team needs detailed rows, formulas, filters, historical comparisons, and manual data validation. A spreadsheet can serve as the underlying measurement register while a shorter executive dashboard presents the most important indicators. The two layers should use the same definitions so that reported totals reconcile.
A Google Sheets structure can be useful when multiple contributors need to enter or review data collaboratively. Regardless of platform, permissions, version control, calculation logic, and ownership should be considered. The important principle is not the software format but the consistency and traceability of the measurement process.
A PDF-style report is often better suited to a fixed-period executive record. It can summarize objectives, performance, significant coverage, insights, risks, and recommendations in a stable layout. A presentation format is useful when the purpose is discussion and decision-making, particularly when stakeholders need a concise narrative supported by a small number of meaningful charts.

What belongs in the executive view
The executive page should answer a small set of questions quickly: What was the objective? What changed? Which results matter? What evidence supports the result? What is working or failing? What should happen next? A dashboard overloaded with every available metric can obscure those answers.
Useful executive indicators may include coverage quality, relevant reach, share of voice, sentiment, message penetration, referral traffic, qualified actions, or another outcome that directly reflects the stated objective. The exact combination should change according to the campaign rather than following a universal list.
Each headline KPI should ideally have a benchmark or target. A standalone number is difficult to interpret. A value becomes more meaningful when the reader can compare it with the previous period, target, benchmark, or defined threshold and immediately understand whether the result is on track.
Using spreadsheets without losing strategic meaning
A spreadsheet should separate raw records from summarized metrics. The raw-data area might contain publication, date, channel, topic, sentiment, message, reach estimate, link, campaign, and other fields. A calculation layer can then aggregate these records into monthly or campaign-level indicators.
Data validation is important because small inconsistencies can create large reporting errors. For example, different spellings of the same publication can cause one outlet to appear as several outlets. Duplicate coverage can inflate mention counts. Missing campaign labels can make attribution incomplete. A measurement template should therefore include rules for naming, deduplication, date handling, and source classification.
Keep calculated fields transparent. If a metric is derived from several inputs, document the formula and source. This is especially important for rates, ratios, share-of-voice calculations, and weighted scores. A stakeholder should be able to understand how a result was produced without relying on an unexplained black-box calculation.
Common measurement mistakes
One major mistake is treating volume as value. More articles, impressions, or social interactions can look impressive, but the increase may have little strategic significance. Quality, relevance, audience fit, sentiment, message accuracy, and downstream response should be considered alongside volume.
Another mistake is relying on advertising value equivalency as the primary representation of PR value. AMEC and related industry guidance have explicitly moved measurement toward outcomes and organizational impact rather than treating an advertising-equivalent figure as the value of public relations. If an organization still records such a number for historical continuity, it should not be confused with evidence of actual PR value.
A third mistake is changing measurement definitions midstream. If one quarter counts syndicated articles individually and another removes duplicates, the trend may reflect a methodological change rather than a performance change. Record methodology changes directly in the template so readers can distinguish genuine movement from changes in measurement.

Research methods behind credible evaluation
Quantitative media monitoring is useful for establishing the scale and distribution of coverage. It can identify mentions, channels, dates, outlets, estimated reach, topics, sentiment classifications, and other structured fields. The quality of the result depends on the search criteria, source coverage, duplicate handling, and classification rules.
Audience research can address questions that monitoring cannot answer. Surveys can measure awareness, recall, understanding, trust, preference, or intention. Pre- and post-campaign measurement can be especially useful when the objective concerns changes in perception. The research design should be appropriate to the question and should avoid claiming that a simple before-and-after movement proves causation.
Qualitative analysis adds another layer. Reviewing representative articles, comments, headlines, stakeholder responses, and message usage can explain why a numerical trend occurred. For example, an increase in positive sentiment may look strong until reviewers discover that most positive mentions came from low-priority channels while key industry publications remained neutral.
Practical Solution
Start by writing one primary communication objective and no more than a manageable set of supporting objectives. For each objective, define the target audience, desired response, organizational relevance, baseline, target, measurement period, and evidence source. Then map the activities expected to influence the objective. This prevents the template from becoming a collection of unrelated statistics.
Next, create a measurement register with columns for KPI name, definition, stage, source, baseline, target, actual, variance, interpretation, and action. Separate output indicators from audience and business outcomes. Review the data at a regular cadence, but change the cadence according to the campaign rather than forcing every program into the same schedule. Record methodological changes, missing data, assumptions, and limitations.
Finally, create an executive summary that converts the measurement register into decisions. Highlight the most important movement, explain the evidence behind it, identify what did not perform as expected, and state what the team should change. A useful template ends every reporting cycle with learning: which channels worked, which messages travelled, which audiences responded, which risks emerged, and where future resources should be concentrated.
For recurring programs, maintain both a detailed measurement layer and a concise reporting layer. The detailed layer protects accuracy and traceability, while the executive layer protects clarity. This combination makes the marketing pr metrics and evaluation Template useful for campaign teams, agency reporting, leadership reviews, and longer-term performance analysis.
A practical monthly review can follow a simple sequence: validate the source data, compare actuals with the baseline and target, identify the largest meaningful changes, inspect representative evidence, interpret the likely drivers, and assign an action. The action might involve changing a message, prioritizing a different media tier, adjusting audience targeting, improving measurement, or collecting additional research before making a strategic decision.

How to improve the template over time
A measurement system should mature with the organization. Early-stage teams may begin with reliable output and audience-response measures. As data quality improves, they can introduce stronger outcome indicators, better audience research, competitive benchmarking, and more sophisticated attribution. The goal is not to make the dashboard increasingly complicated; it is to make the evidence increasingly useful.
Review the KPI set periodically and remove indicators that no longer influence decisions. If a metric has appeared in every report but has never changed an action, ask whether it still belongs. Conversely, add measures when an important strategic question cannot currently be answered. A good measurement system evolves around the decisions leaders actually need to make.
Also document ownership. Every important KPI should have a responsible person or team, a known source, a defined calculation, and a reporting cadence. This reduces last-minute data hunting and helps preserve consistency when responsibilities change.

Reference Examples
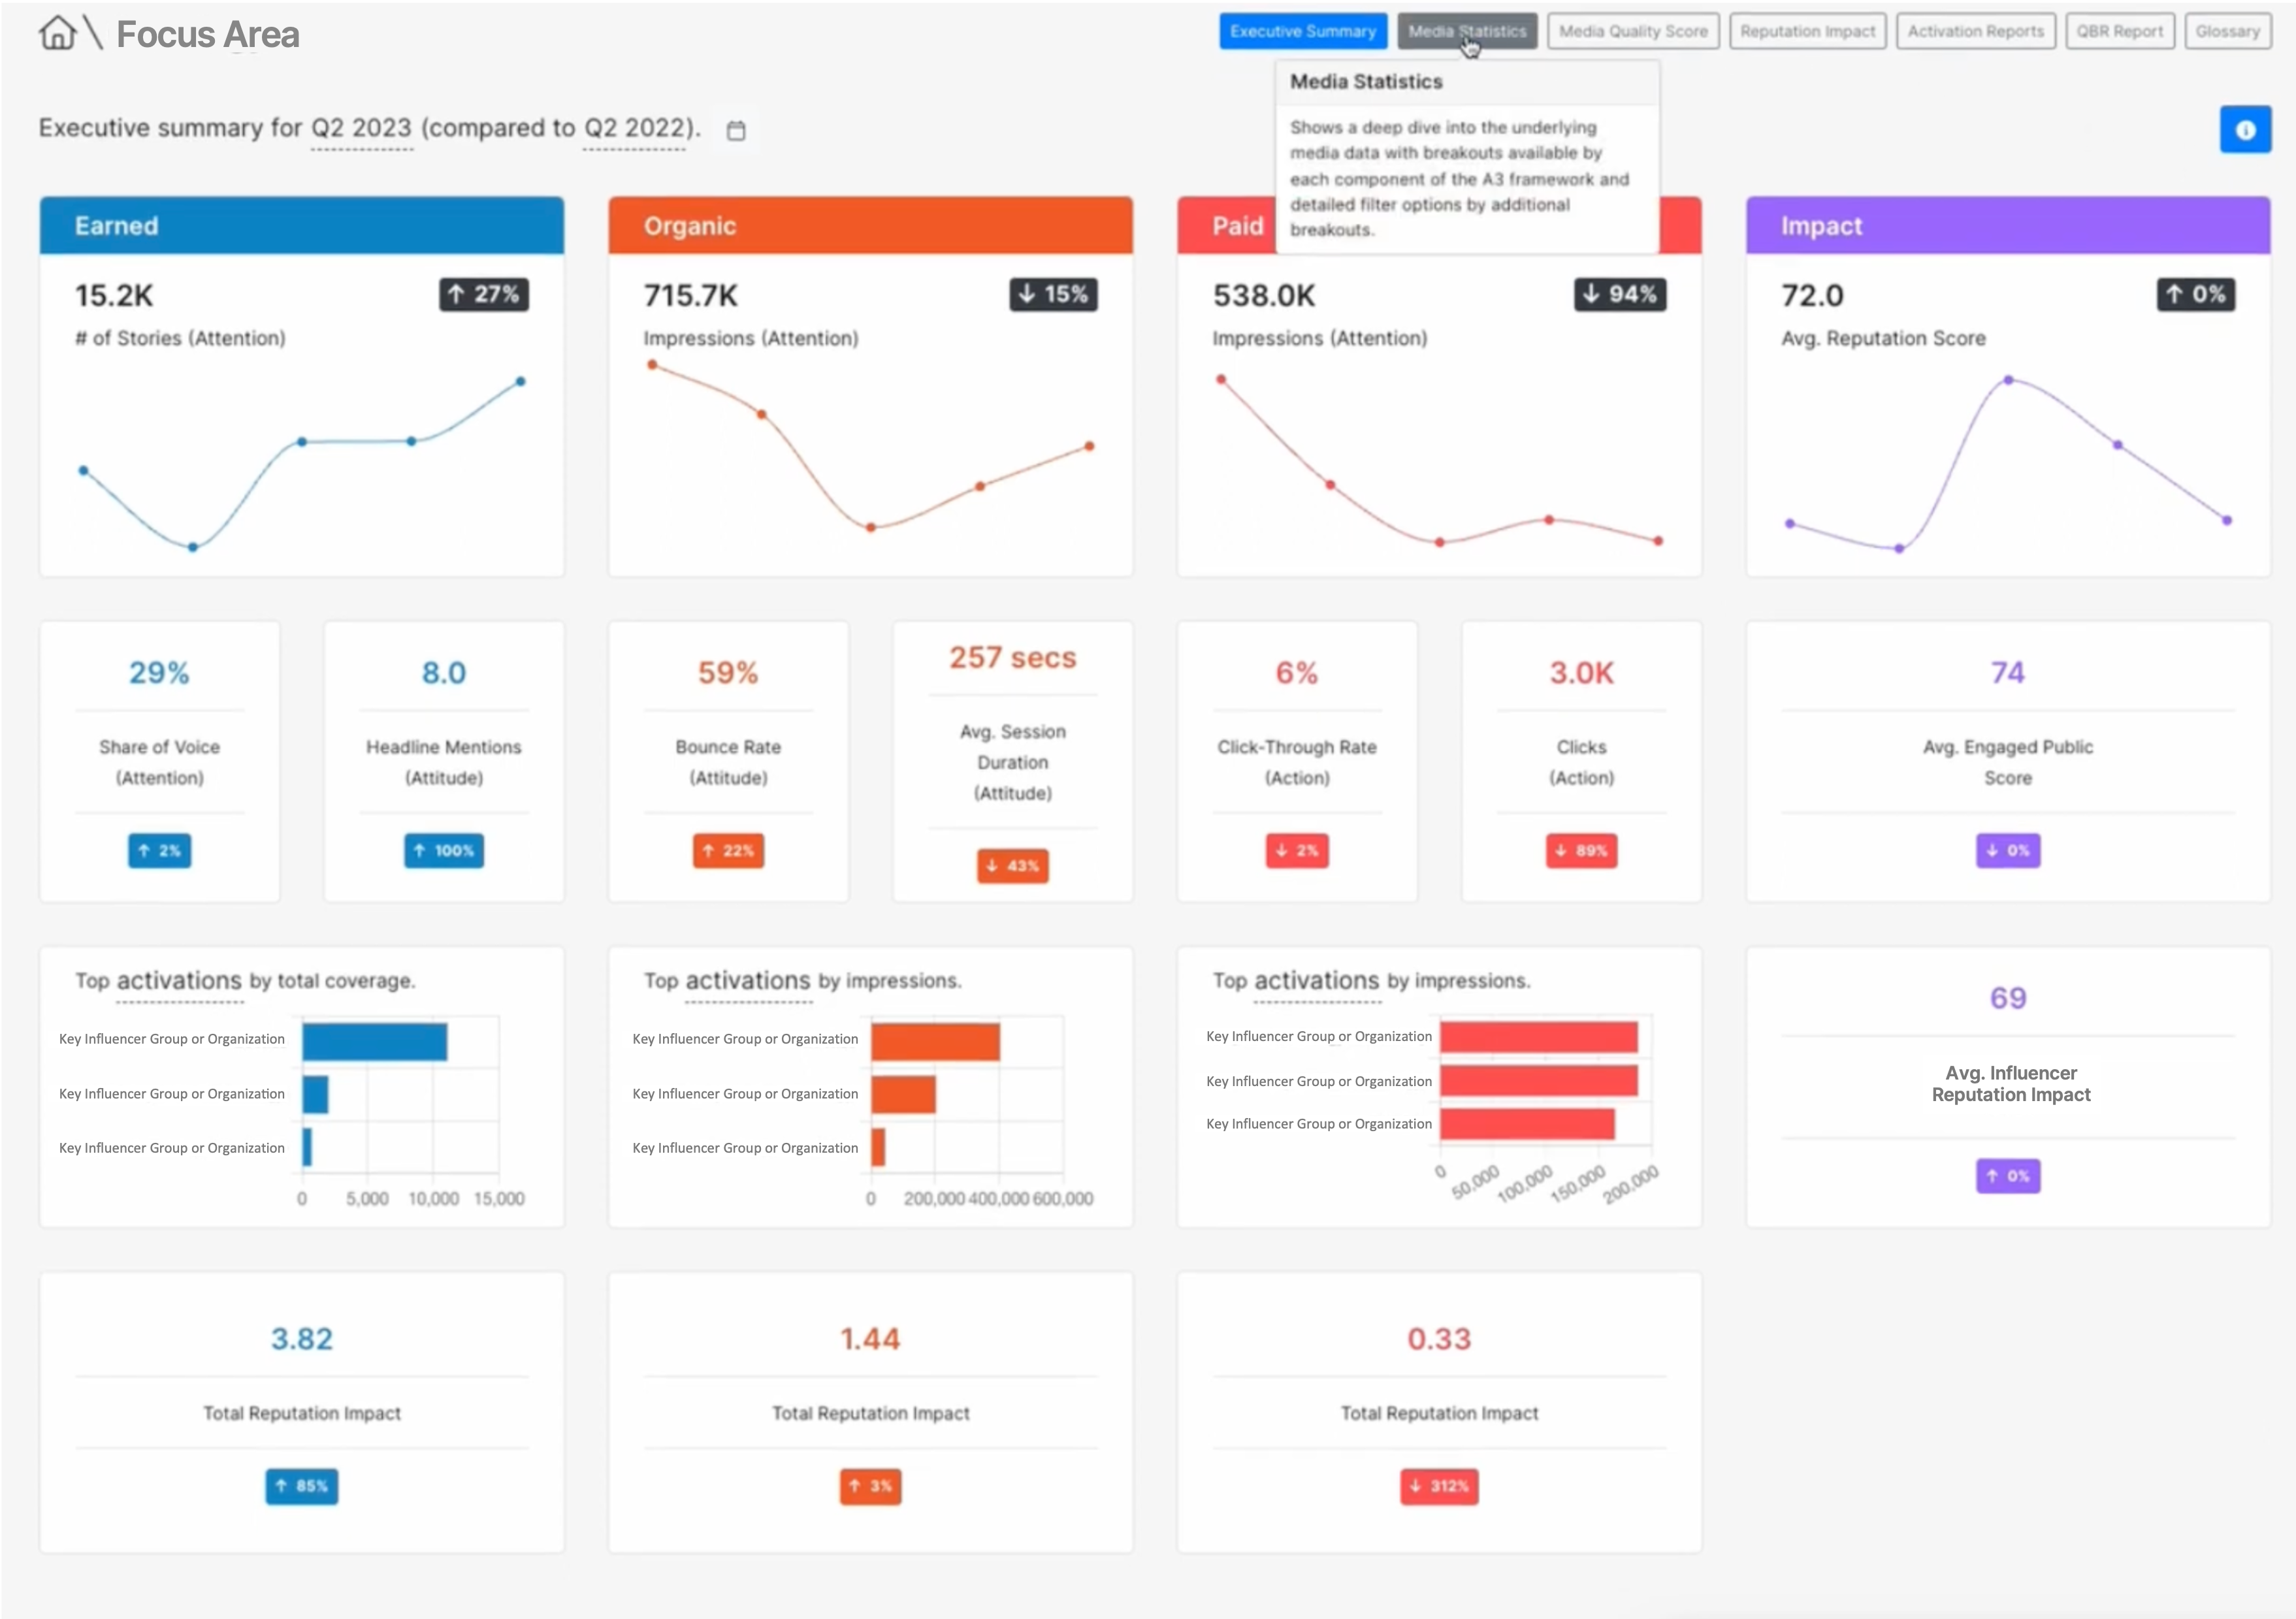
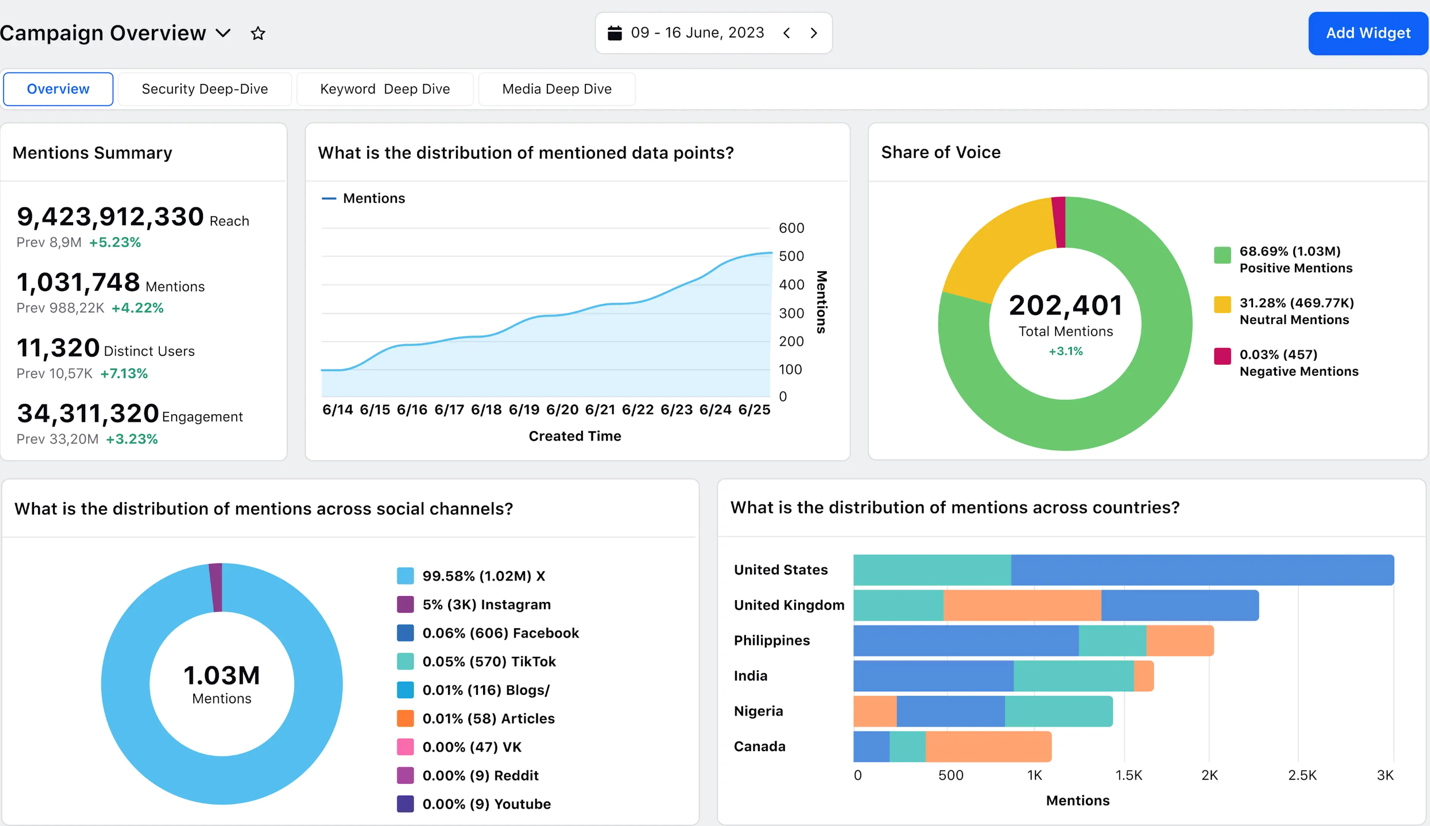
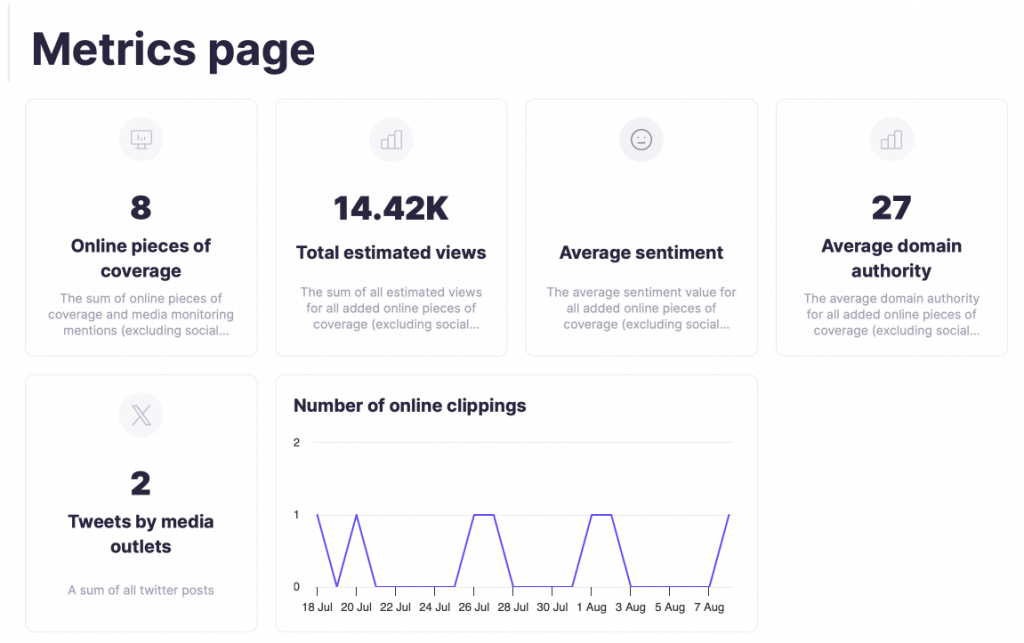
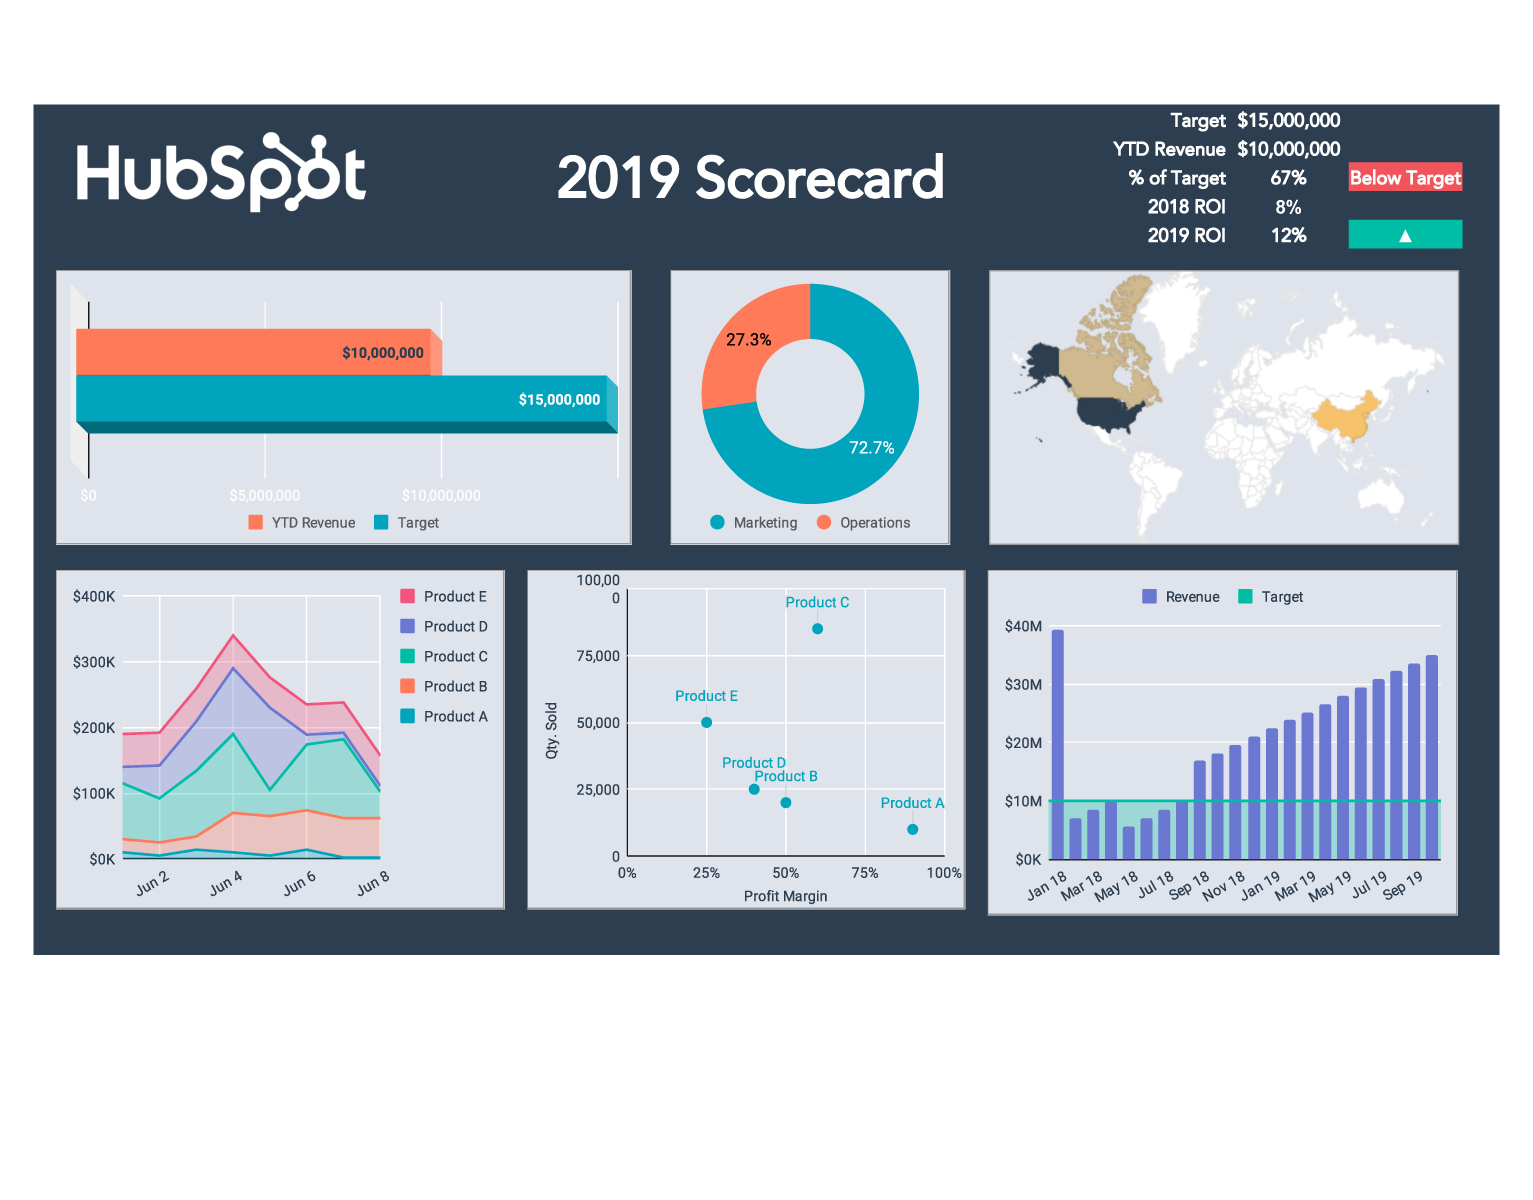
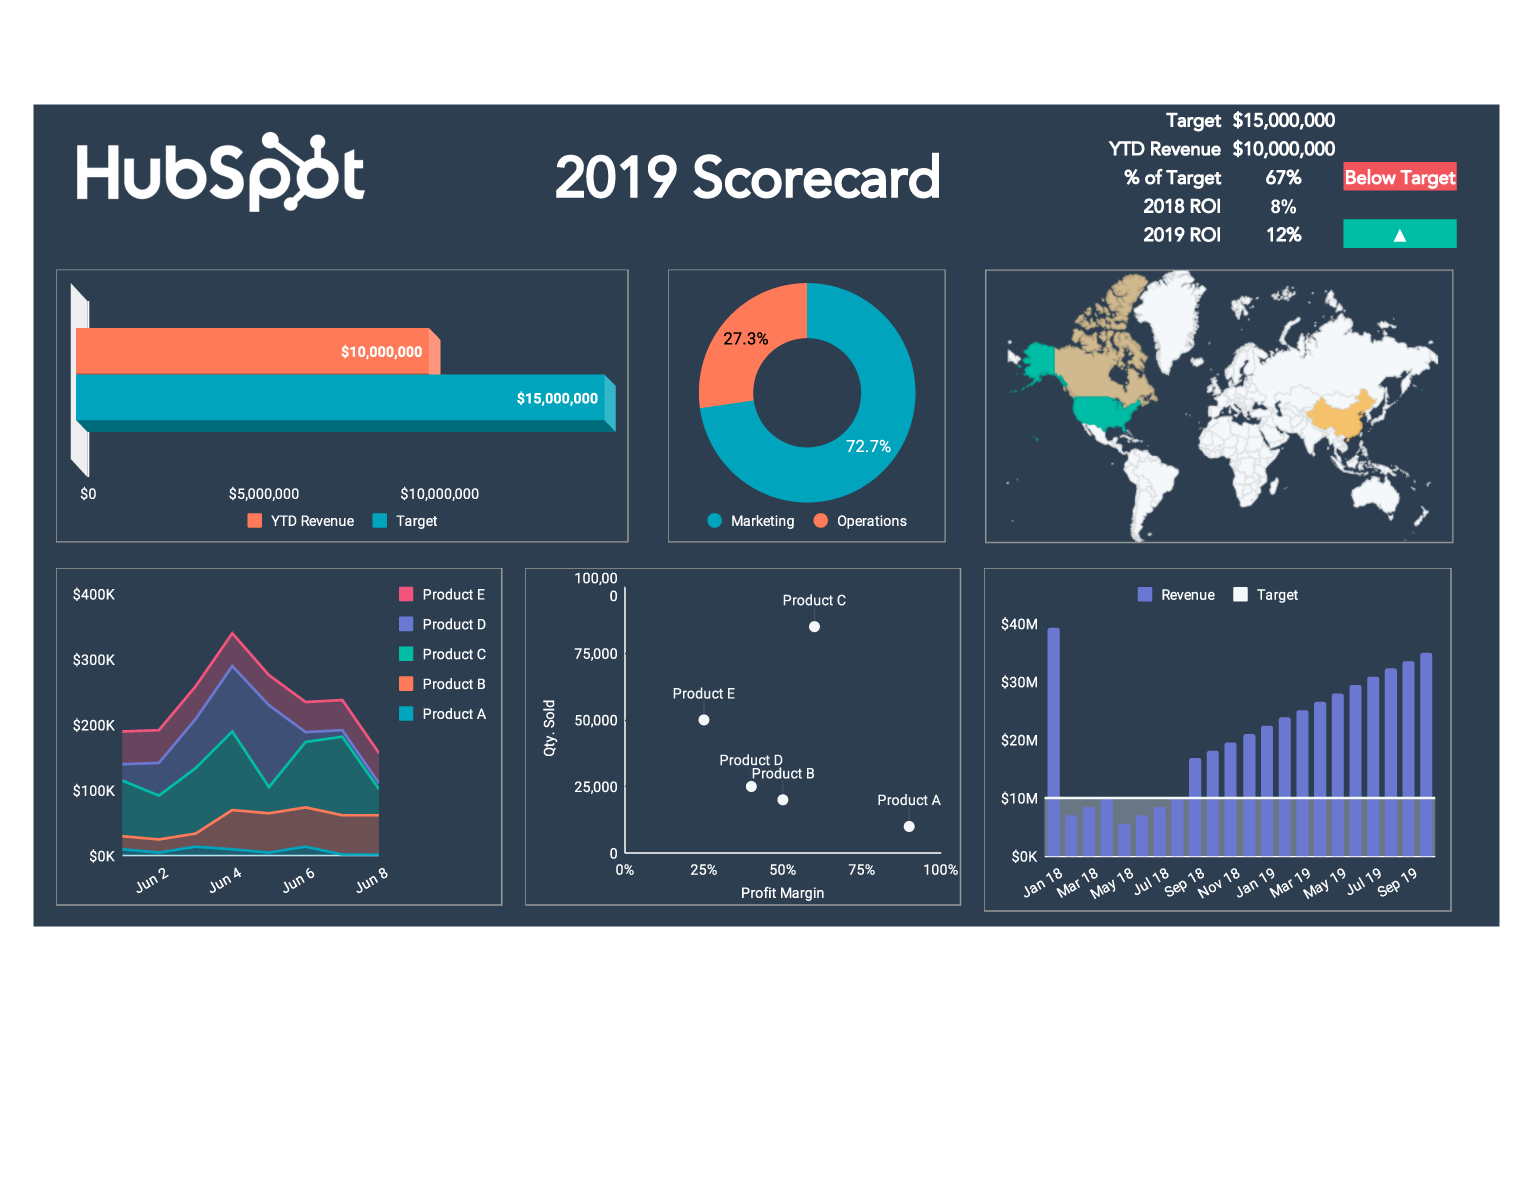
A marketing pr metrics and evaluation Template is easiest to understand when readers can see how measurement concepts become visual reporting structures. The examples below show different ways of presenting coverage, targets, trends, sentiment, reach, share of voice, and business-oriented performance indicators. They are useful as visual references rather than universal models because the right dashboard depends on the objective, audience, measurement method, and available evidence.
When reviewing these examples, focus on structure rather than copying individual numbers or layouts. Look for the relationship between headline KPIs and supporting charts, the use of benchmarks, the distinction between activity and impact, and the way a report makes changes visible over time. A strong reference should help a team recognize which visual components could improve its own marketing pr metrics and evaluation Template while still adapting the underlying metrics to its specific objectives.

PR Dashboard Overview
Source: Bader Rutter
Campaign Overview Dashboard
Source: Sprinklr
Impact Intelligence Example
Source: Edelman
2025 Scorecard
Source: HubSpot
KPI Dashboard to Monitor PR Marketing Campaign Performance
Source: SlideTeam

Prowly Coverage Dashboard
Source: Prowly
