A nonprofit organization quarterly financial Template is a structured reporting framework that helps an organization compare financial plans with actual results, understand cash position, monitor restricted and unrestricted resources, and give leaders a consistent view of financial performance. A strong quarterly format is more than a collection of numbers. It connects revenue, expenses, cash movement, assets, liabilities, net assets, funding restrictions, and management commentary into one reporting cycle.
Quarterly reporting is especially useful because annual figures can hide timing problems. A nonprofit might appear financially healthy at year-end while experiencing a cash shortage during one quarter, receiving a major grant later than expected, or spending program funds faster than planned. A quarterly report makes these movements visible while there is still time to respond. Internal reporting guidance for nonprofits also emphasizes the value of executive summaries, dashboards, and clear comparisons that help board members understand financial information. :contentReference[oaicite:0]{index=0}
The best structure should therefore be designed around decisions rather than simply accounting categories. Finance staff need accurate detail, program leaders need meaningful budget comparisons, executives need forecasts, and board members need a concise picture of financial health and risk. The same underlying data can support all of these audiences when the quarterly template is organized carefully.

What a Quarterly Nonprofit Financial Template Should Accomplish
The central purpose of quarterly financial reporting is to turn accounting records into management information. A quarterly report should show what the organization expected to happen, what actually happened, why the difference occurred, and what management expects to happen next. This makes the document useful for governance rather than merely archival recordkeeping.
A practical quarterly structure usually begins with a reporting-period header containing the organization name, fiscal year, quarter, reporting date, and accounting basis. Beneath that, the report can present a financial summary followed by revenue, expenses, budget variances, cash flow, balance-sheet information, and selected performance indicators. The exact sections should reflect the organization’s size, funding model, programs, and reporting obligations.
Quarterly reporting should also preserve traceability. Each important figure should be capable of being reconciled to the underlying accounting records. That means account categories should remain consistent, unusual transactions should be explained, and changes to the budget should be documented rather than silently replacing the original plan. A well-designed template creates a repeatable process that reduces ambiguity from one quarter to the next.

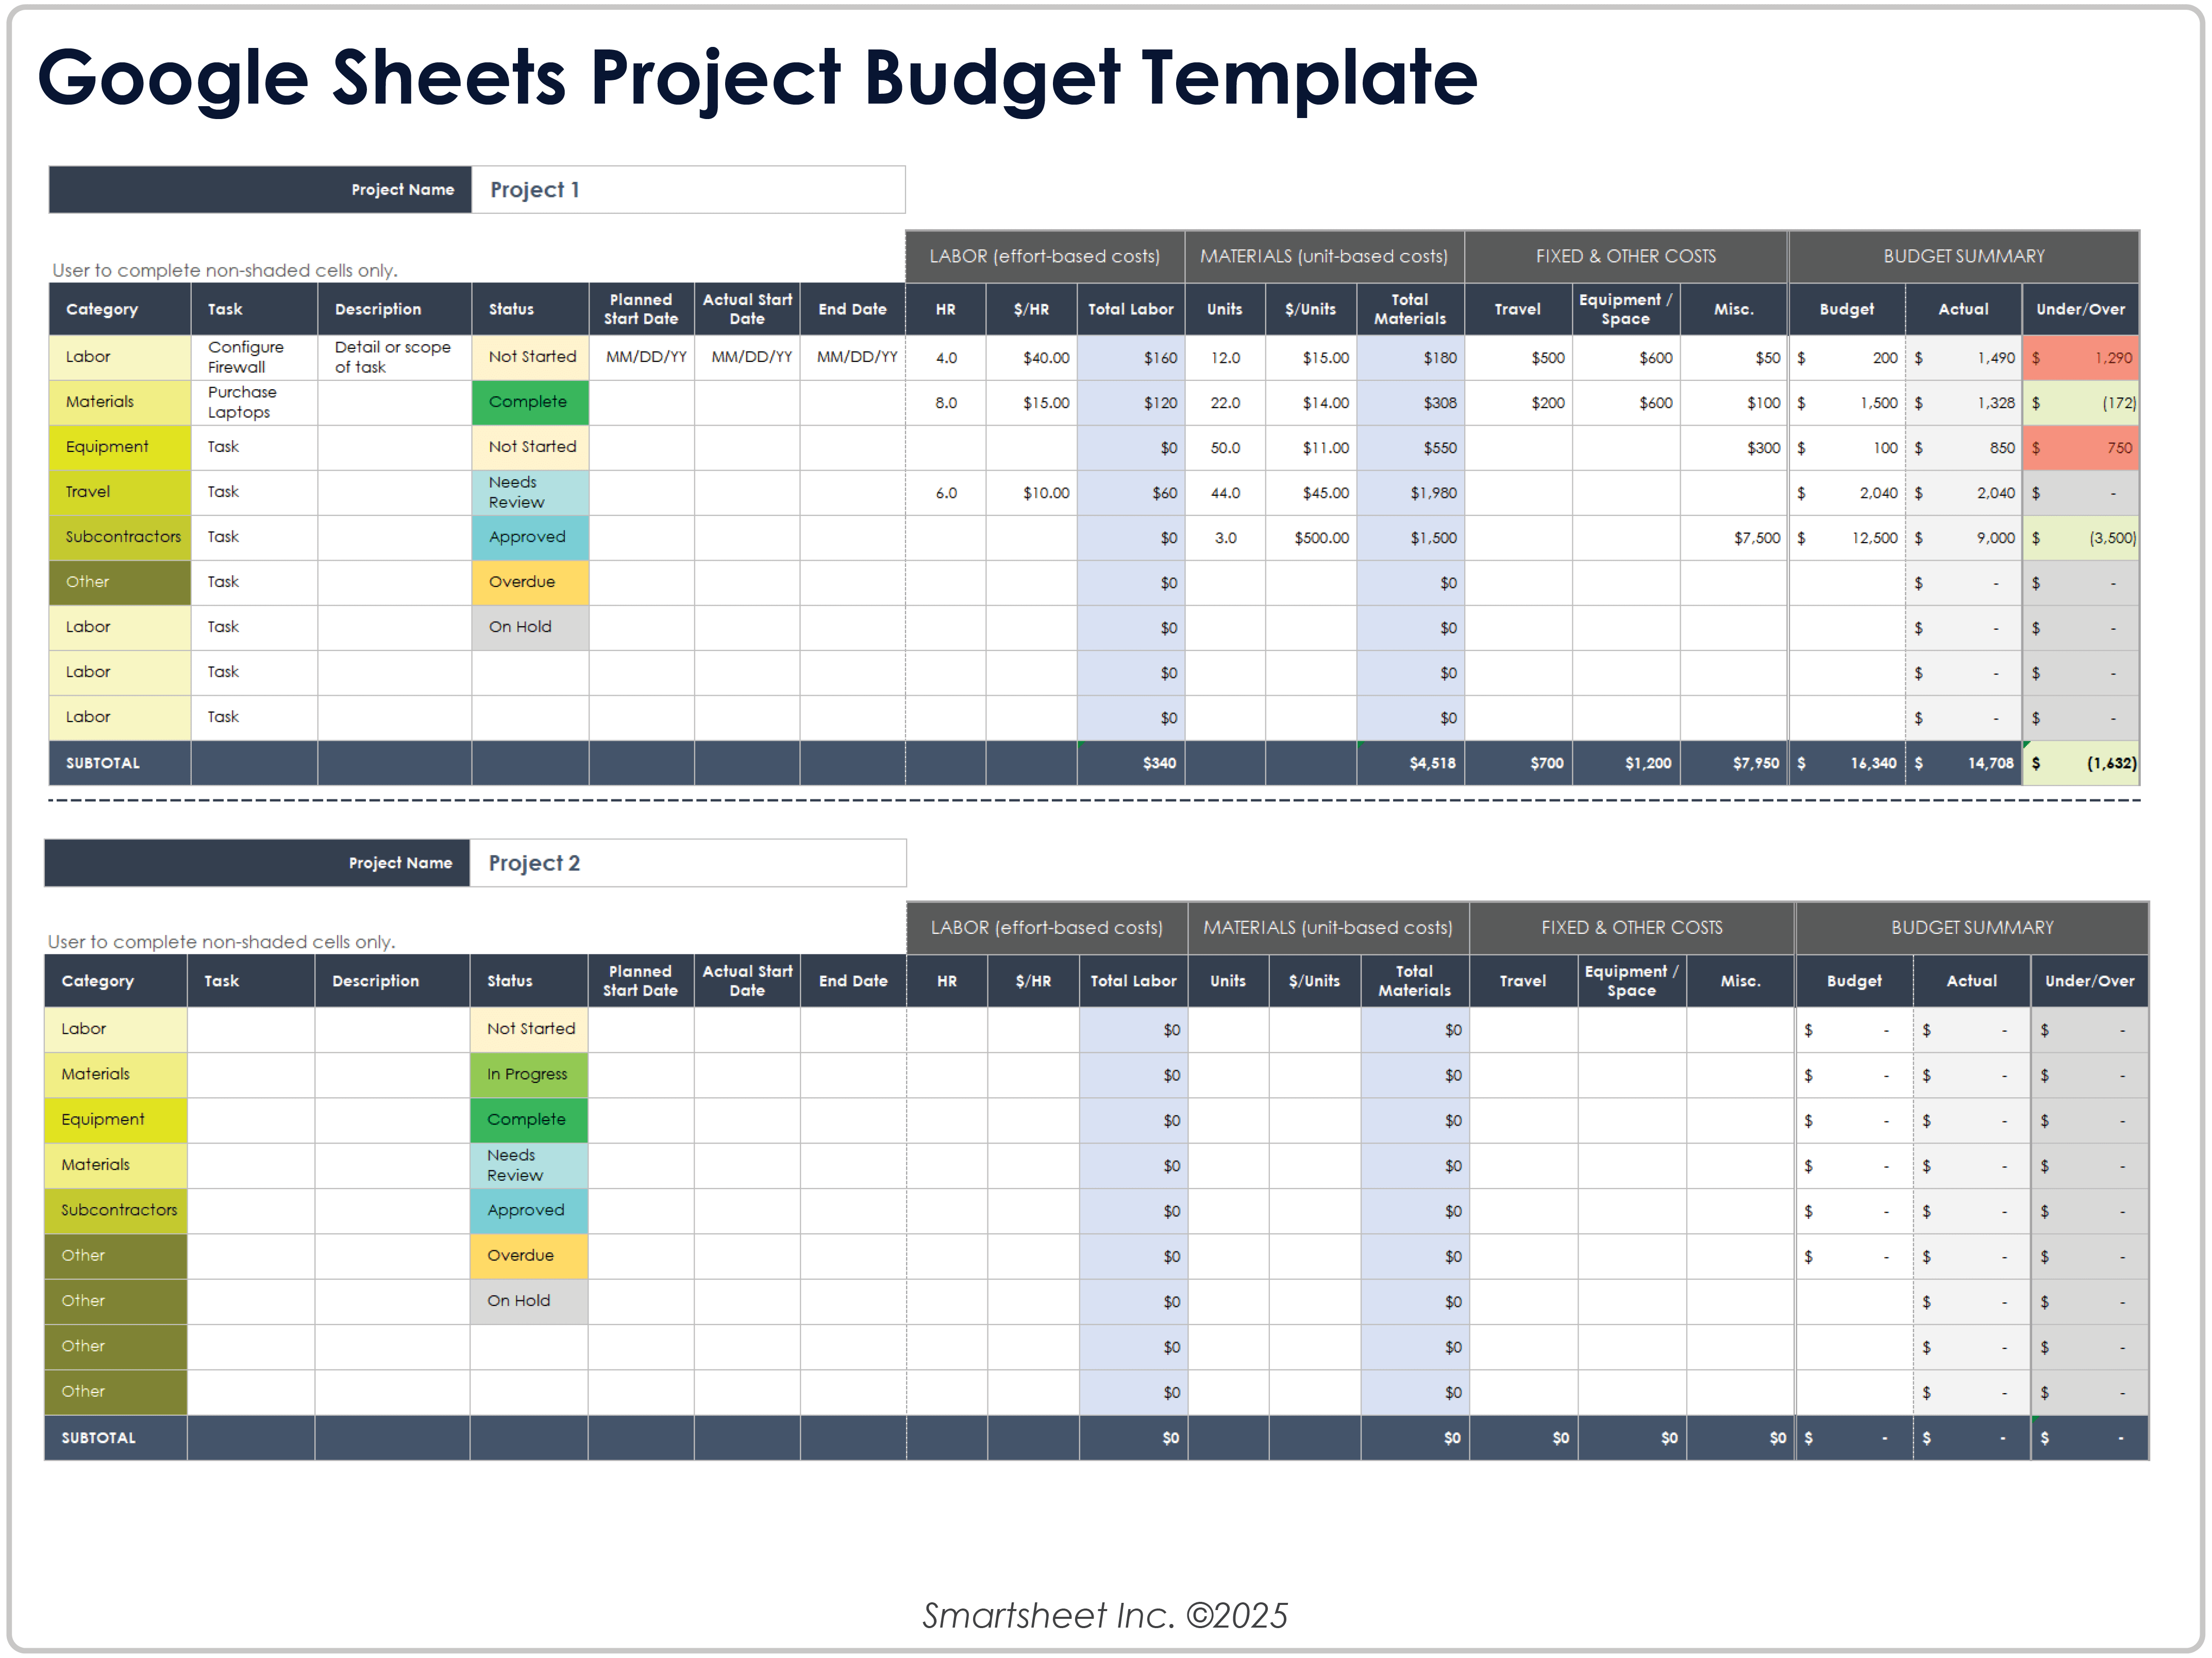
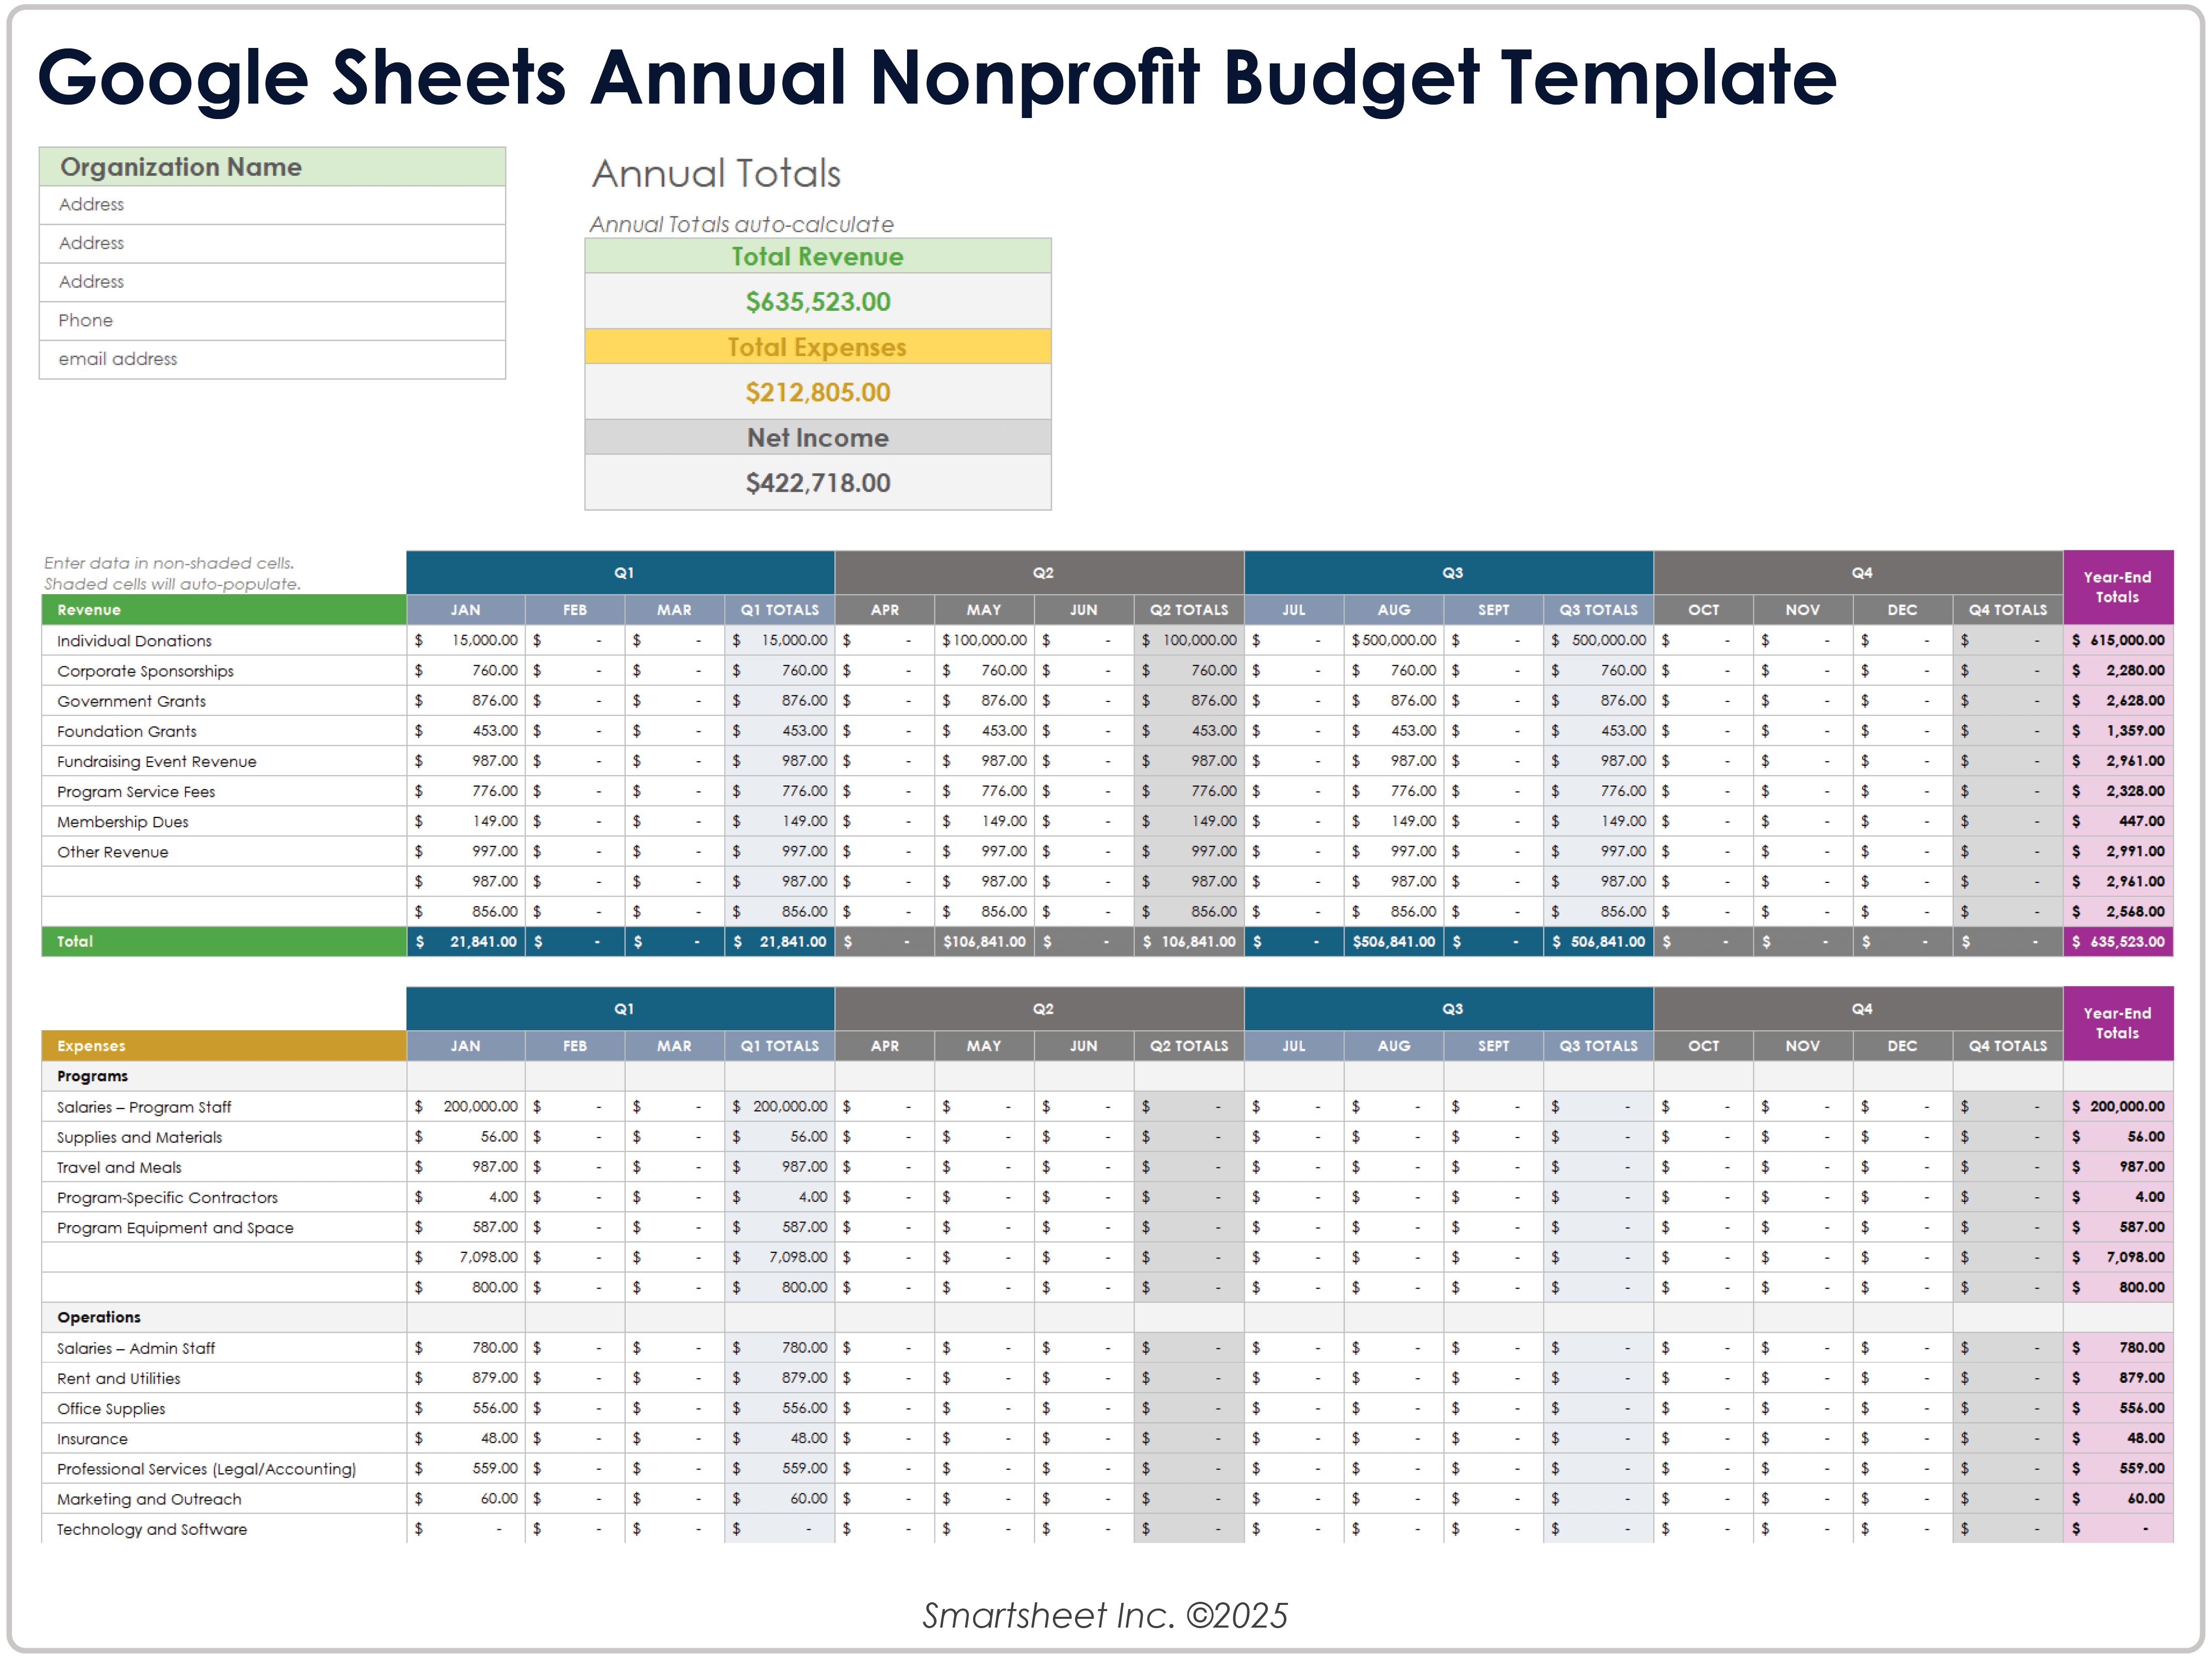
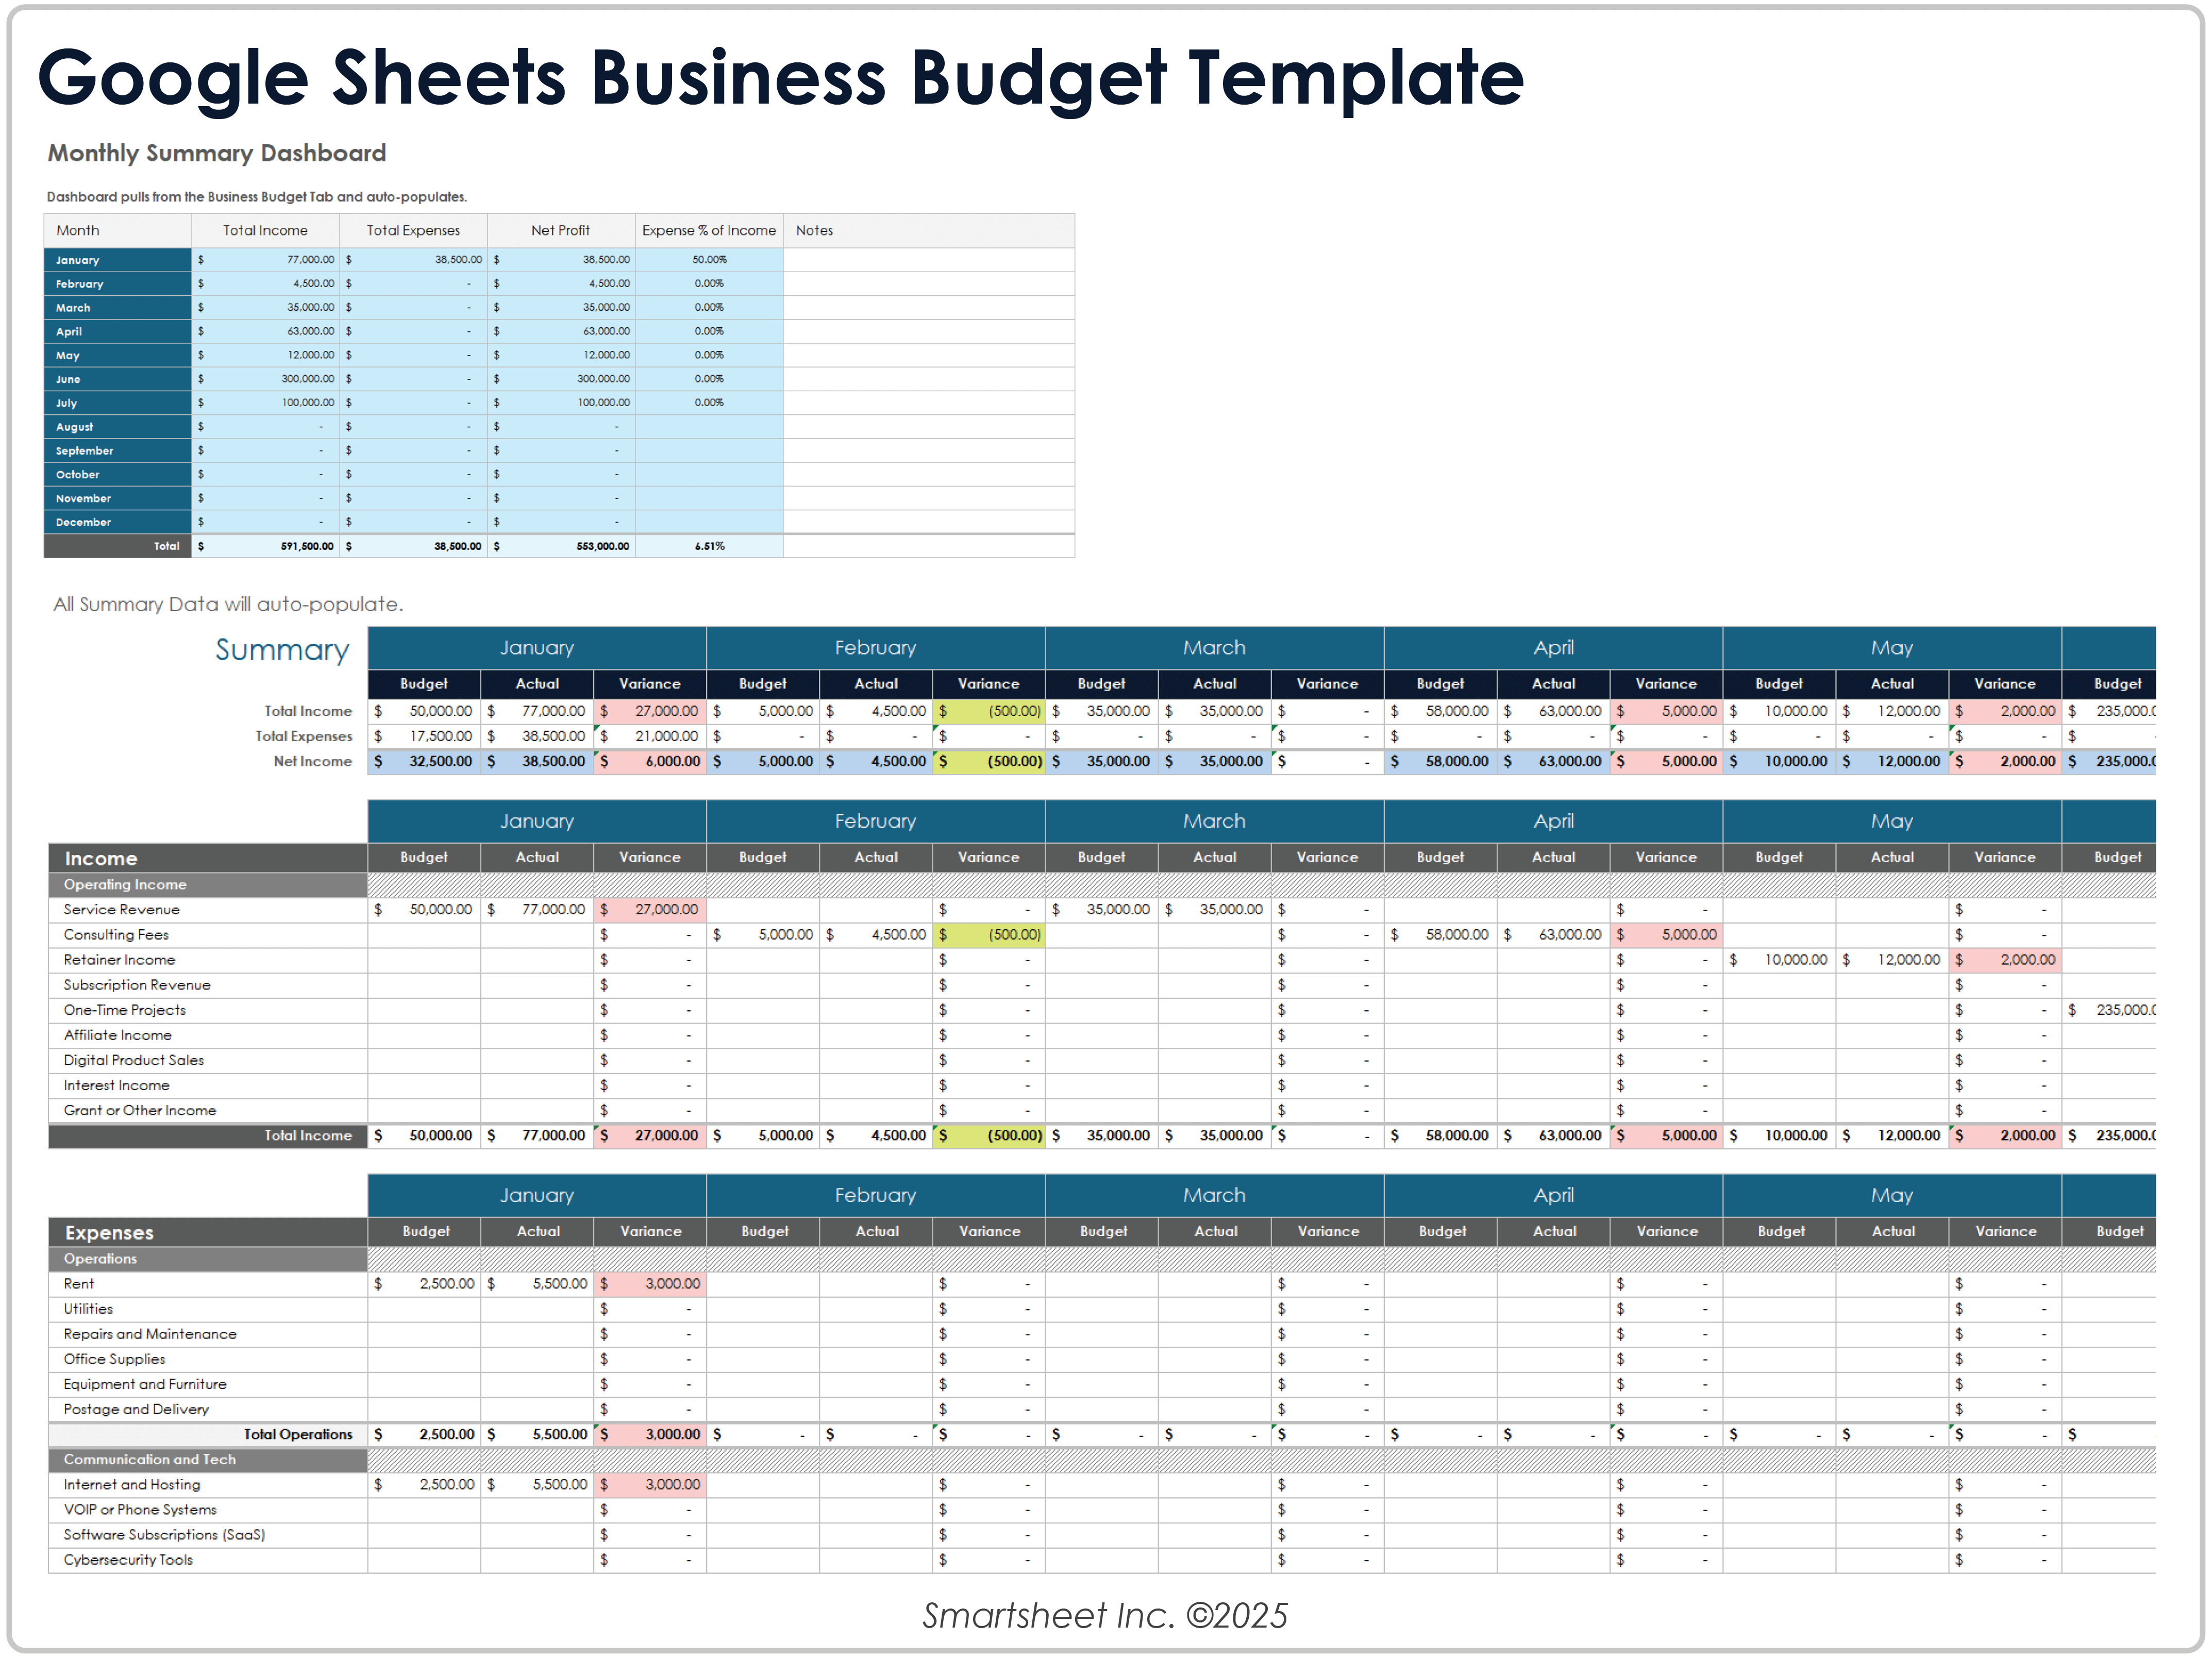
The layout shown in a quarterly-oriented budget can be adapted into a nonprofit organization quarterly financial template excel structure by using monthly source data and quarterly subtotal columns. The important principle is not the software itself but the consistent relationship between budget, actual, variance, and year-to-date values.

Core Sections to Include
A useful quarterly report should contain enough detail to explain performance without overwhelming its audience. The first major section is normally a financial snapshot. This can include total revenue, total expenses, change in net assets, ending cash, significant receivables, major liabilities, and selected budget variances. These figures establish the financial story before readers move into detailed schedules.
The second section should explain revenue. Common categories can include individual contributions, foundation grants, government grants, membership income, program service revenue, fundraising events, investment income, and other support. Revenue should be separated when restrictions, timing, or management decisions make the distinction important.
The third section covers expenses. A useful design separates major natural categories such as salaries, benefits, occupancy, supplies, professional services, technology, travel, insurance, and program costs. It should also preserve functional information where needed, because nonprofit reporting often distinguishes program services from management and general activities and fundraising.

For organizations managing several programs, the quarterly report should allow financial results to be reviewed by program as well as by organization. This helps management understand whether an overall surplus is masking a deficit in a particular service area. Program-level reporting can also make grant management and resource allocation more transparent.

Budget Versus Actual
Budget-versus-actual analysis is one of the most valuable parts of a quarterly report. The basic calculation is straightforward: actual results are compared with the corresponding approved budget. A variance should then be interpreted rather than merely displayed. A revenue shortfall may indicate delayed funding, while an expense variance may reflect timing, staffing changes, or a genuine cost increase.
Variance percentages are useful, but they should not be interpreted in isolation. A small budget line can show a large percentage difference without creating a material financial concern. Conversely, a large budget category can be materially different even when its percentage variance appears modest. Good reporting therefore combines percentage variance with dollar significance and management commentary.
For revenue, higher-than-budget results are often favorable, while lower results may require attention. For expenses, the interpretation is normally reversed: spending above budget may be unfavorable, while spending below budget may be favorable. However, timing matters. Spending below budget because a planned program has not yet started is not necessarily a genuine saving.

Cash Flow and Liquidity
Cash flow deserves its own section because revenue and expenses do not always move at the same time as cash. A nonprofit may recognize a grant under its accounting method before receiving the associated cash. Similarly, expenses can be incurred before payment. A quarterly financial report that shows only income and expenses can therefore miss an important liquidity issue.
A cash-flow section should normally show opening cash, expected receipts, actual receipts, operating payments, investing or capital activity when relevant, financing activity when relevant, and ending cash. A forward-looking forecast can extend the view into the next quarter so management can identify potential cash pressure before it becomes urgent.
Cash should also be interpreted according to its availability. Donor-restricted funds may not be available for general operating purposes even when they are included in the organization’s bank balance. A useful management report therefore distinguishes unrestricted operating liquidity from resources that have external or internal restrictions.

A monthly source schedule can feed quarterly totals automatically. This approach is often easier to audit because the quarterly number can be traced to individual months. It also allows management to identify seasonal fundraising patterns, grant-payment timing, payroll cycles, and recurring operating costs.
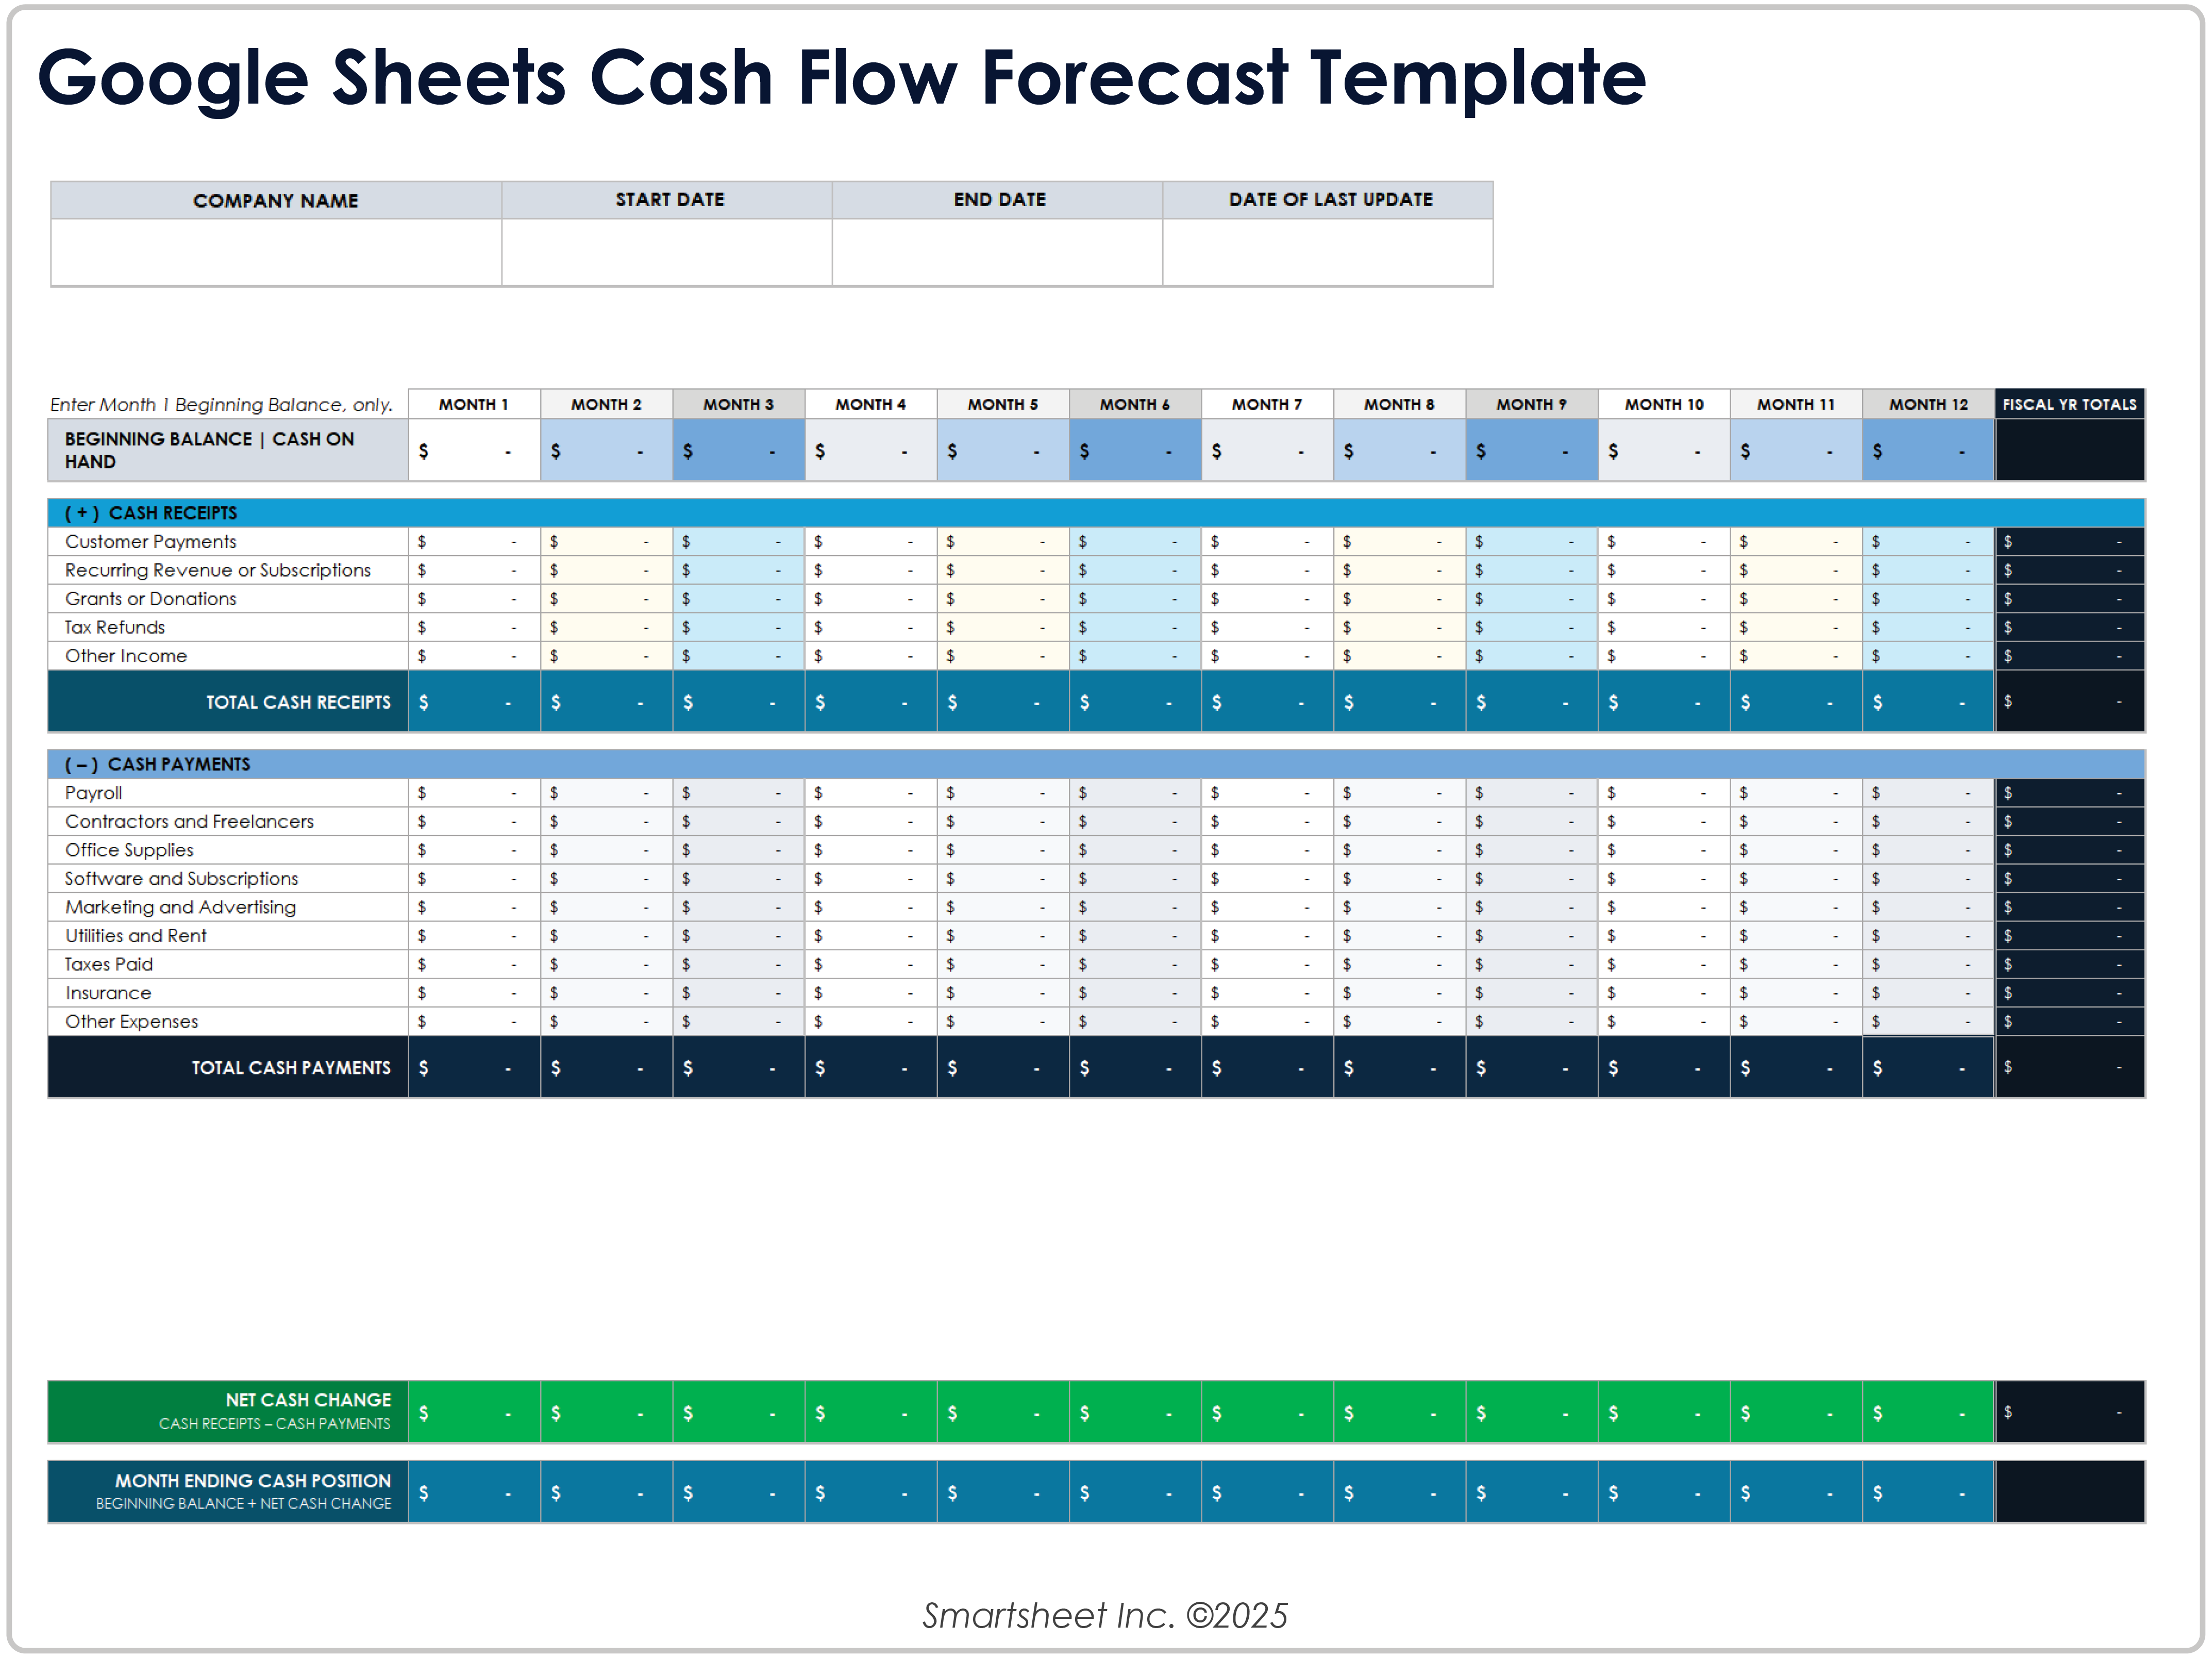
The phrase nonprofit organization quarterly financial template google sheets describes a practical collaborative format when several authorized users need access to the same reporting workbook. Regardless of platform, access controls, version history, reconciliation procedures, and clear ownership remain important.

Statement of Financial Position
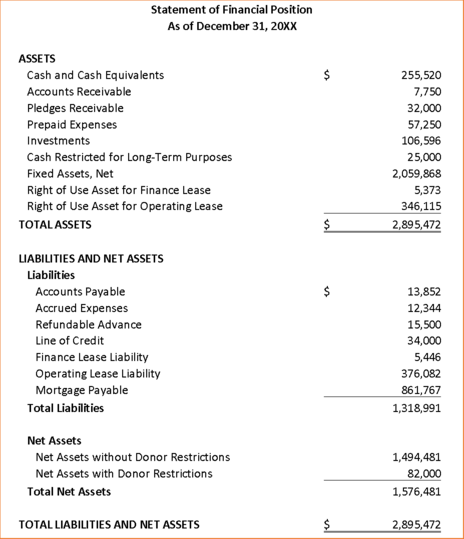
A quarterly package should normally include a statement of financial position or a management-level summary derived from it. This report shows assets, liabilities, and net assets at a specific date. Unlike a statement that covers a period, it provides a point-in-time view of financial condition.
Typical assets can include cash and cash equivalents, contributions receivable, grants receivable, prepaid expenses, investments, property, and equipment. Liabilities can include accounts payable, accrued expenses, deferred revenue, loans, leases, and other obligations. The remaining amount is presented as net assets rather than owners’ equity.
Net assets can require additional classification depending on donor restrictions and the applicable accounting framework. A quarterly management report should therefore avoid treating all cash or all net assets as equally available. Restrictions, board designations, grant conditions, and timing requirements can materially affect how much of the reported resources can support general operations.

A useful quarterly review asks whether assets are growing or declining, whether receivables are being collected as expected, whether liabilities are increasing faster than available resources, and whether liquidity remains adequate. These questions turn the statement from a static accounting document into a management tool.
Statement of Activities and Functional Expenses
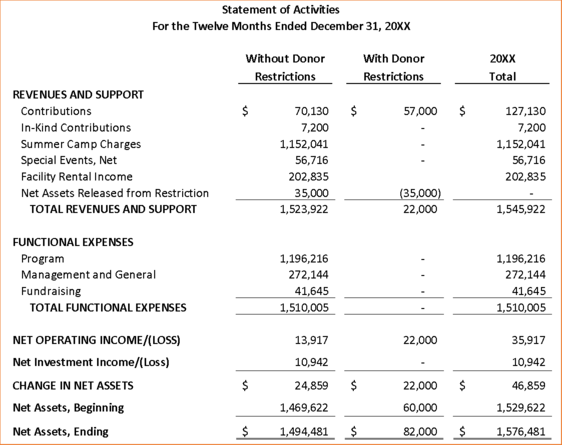
The statement of activities summarizes revenue, support, expenses, and changes in net assets over a defined period. For quarterly management reporting, it can be presented for the current quarter alongside year-to-date figures and the corresponding budget. This helps readers distinguish a temporary quarterly fluctuation from a persistent annual trend.
The presentation should preserve important distinctions such as donor restrictions when those distinctions affect interpretation. A grant restricted to a particular purpose should not be treated as though it were unrestricted operating revenue. Likewise, a release of restricted net assets can change the presentation of resources without representing new cash received in that quarter.
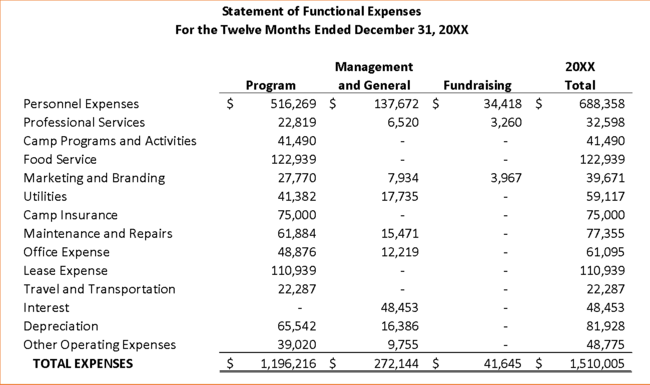
The statement of functional expenses adds another layer by showing how costs relate to mission delivery, management and general activity, and fundraising. This is particularly useful when a board wants to understand how resources are being allocated rather than simply seeing total spending.
A quarterly package does not necessarily need to reproduce every line of the annual financial statements. Instead, it can provide a management summary with enough detail to identify material movements, followed by supporting schedules when more information is needed.
The nonprofit organization quarterly financial template pdf concept is useful when the final report must be presented as a fixed, printable record. A fixed-format version is particularly helpful for board packets because page breaks, headings, and figures remain consistent during review.

Choosing a Format for Different Reporting Needs
A spreadsheet is often the best starting point for calculations because quarterly totals, year-to-date figures, and variances can be linked to monthly data. A document-based format is more appropriate when the emphasis is on narrative explanation, board commentary, management discussion, or a polished reporting package. The strongest workflow can combine both: calculations remain in the financial workbook while the narrative report explains the important movements.
The phrase nonprofit organization quarterly financial template word can therefore refer to the presentation layer rather than the accounting engine. A document can contain an executive summary, financial highlights, variance explanations, cash outlook, program commentary, and action items while figures are sourced from controlled accounting schedules.
Similarly, a nonprofit organization quarterly financial template doc can be structured as a recurring board-reporting document with fixed headings. This is useful when each quarter should follow the same sequence so directors can quickly identify what changed from the previous meeting.
For organizations considering a nonprofit organization quarterly financial template uk, the internal quarterly report should be distinguished from formal statutory reporting. Charity Commission guidance for England and Wales focuses on annual accounts and trustees’ reporting, with accounting and reporting frameworks governed by charity-specific requirements. A quarterly management report can support governance, but it should not be presented as a substitute for the formal annual reporting obligations that apply to a particular charity. :contentReference[oaicite:1]{index=1}
For a nonprofit organization quarterly financial template australia, the same distinction matters. The Australian Charities and Not-for-profits Commission requires registered charities to report annually, while medium and large charities have additional annual financial-report requirements. Small charities may use cash or accrual accounting for their annual financial reporting within the conditions described by the ACNC. :contentReference[oaicite:2]{index=2}
A nonprofit organization quarterly financial template for small organizations should avoid unnecessary complexity. A smaller nonprofit may need only a concise budget-versus-actual statement, cash forecast, statement of financial position, restricted-fund summary, and short management commentary. The goal is reliable information, not an elaborate workbook that staff cannot maintain.

How to Build the Quarterly Reporting Workflow
The first step is to define the reporting calendar. Establish the quarter-end date, accounting close deadline, reconciliation deadline, management review date, and board distribution date. A consistent timetable prevents the quarterly report from becoming a last-minute exercise and gives finance staff enough time to investigate unusual transactions.
The second step is to close the underlying accounting period. Reconcile bank accounts, review receivables and payables, confirm payroll entries, record necessary accruals, review restricted funding, and verify major transactions. The report should be generated only after the underlying numbers are sufficiently complete for management use.
The third step is to populate the budget-versus-actual section. Use the same account and program structure throughout the fiscal year. If the approved budget has been formally revised, preserve the original budget and identify the revised version clearly so readers can understand how expectations changed.

The fourth step is variance review. Establish a materiality threshold appropriate to the organization’s size and reporting needs. Then investigate significant revenue and expense differences. Each major variance should answer three questions: what happened, why did it happen, and what is expected next?

The fifth step is management commentary. Commentary should focus on decisions and implications rather than restating numbers. For example, instead of saying that grant revenue was below budget, explain that a scheduled grant payment shifted into the next quarter and state whether the timing change affects current cash expectations.
The sixth step is review and approval. Finance staff should review calculations, management should review explanations and forecasts, and the appropriate finance committee or board should receive the final package according to the organization’s governance process. Supporting schedules should be retained so material figures can be traced back to source records.

Practical Solution
The most practical solution is to build the quarterly report as a connected reporting cycle rather than as a single worksheet. Start with the chart of accounts and program structure, then create monthly actuals, approved budget, quarterly summaries, year-to-date calculations, cash-flow forecasts, and management commentary. Each layer should pull from the same underlying categories so totals do not have to be retyped in multiple places.
For a small organization, begin with five core schedules: revenue and support, expenses, budget versus actual, cash flow, and statement of financial position. Add restricted-fund tracking if donor or grant restrictions make it necessary. Add program-level reporting when the organization manages several programs or receives funding that must be tracked by project.
For a larger organization, extend the model by adding fund, grant, department, program, location, and project dimensions where those classifications are meaningful. Use consistent account codes and allocation policies. The ACNC notes that appropriate financial records should correctly record and explain transactions and financial position and should support the preparation of true and fair financial statements. :contentReference[oaicite:3]{index=3}
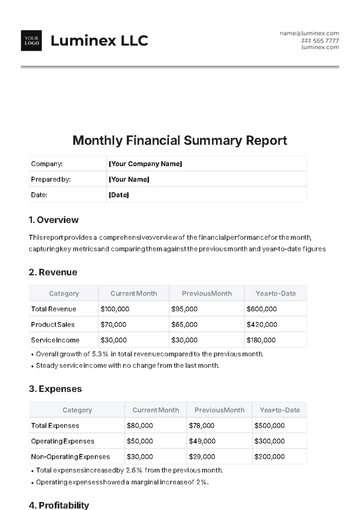
Another practical improvement is to create an executive summary at the beginning of every quarterly package. Limit it to the most important financial movements: revenue performance, expense performance, cash and liquidity, significant restricted resources, major variances, forecast changes, and decisions required from leadership. This gives board members a useful entry point before they review detailed schedules.
Finally, preserve the reporting history. Do not overwrite prior quarters when the new quarter begins. Retain the approved budget, quarterly actuals, variance explanations, revised forecasts, and management decisions. This creates a clear financial record that can support future planning, audit preparation, grant reporting, and board review.
Common Mistakes to Avoid
One common mistake is mixing cash-basis and accrual-basis figures without clearly identifying the difference. Cash reporting focuses on when money is received or paid, while accrual reporting recognizes revenue and expenses according to the applicable accounting basis. The ACNC specifically explains this distinction and notes that small Australian charities may have different accounting options from medium and large charities. :contentReference[oaicite:4]{index=4}
Another mistake is treating every variance as a problem. Timing differences can create temporary variances that reverse later. A delayed grant, postponed hiring decision, or rescheduled event can make one quarter look unusual without changing the full-year outlook. Good quarterly reporting separates timing effects from structural changes.
A third mistake is presenting a large cash balance without explaining restrictions or upcoming obligations. Liquidity is about resources that can actually be used to meet near-term commitments. A report that combines restricted and unrestricted cash without explanation can give decision-makers an inaccurate impression of financial flexibility.
Another issue is excessive detail. A quarterly board report should not force every reader through the general ledger. Detailed schedules can remain available as supporting material while the main report highlights material movements, risks, forecasts, and decisions. Nonprofit financial reporting guidance emphasizes that dashboards and executive summaries can help non-financial board members interpret financial information more effectively. :contentReference[oaicite:5]{index=5}

Finally, avoid changing category definitions from quarter to quarter. If salaries are included in one category in the first quarter and split into several unrelated categories later, trend analysis becomes difficult. Consistent definitions are one of the simplest ways to make a quarterly reporting system more useful over time.
What Makes a Strong Quarterly Report Board-Ready
A board-ready report should answer the questions directors are most likely to ask. Are revenues tracking to plan? Are expenses controlled? Is cash sufficient for upcoming obligations? Are restricted funds being used appropriately? Are there material liabilities or receivables? Which programs are performing differently from expectations? Has the year-end forecast changed? What decisions require board attention?
The report should also distinguish information from interpretation. A number is evidence; the commentary explains its significance. For example, a 12% expense variance alone does not tell the board whether the variance is concerning. The explanation might show that the difference resulted from a vacant position, an accelerated program launch, a supplier price change, or an accounting timing issue.
Visual summaries can make this distinction easier. A compact revenue-versus-expense chart, cash trend, budget variance panel, or net-asset trend can help readers identify patterns before examining detailed schedules. The objective is not decoration but faster comprehension.
A quarterly reporting package should also include clear reporting dates. Every figure needs a period or as-of date. Mixing current-quarter figures with year-to-date values without clear labels is a frequent source of confusion, especially when the organization has seasonal revenue.
Final Design Principles
The strongest nonprofit organization quarterly financial Template is consistent, traceable, decision-oriented, and proportionate to the organization’s complexity. It should connect the approved plan with actual accounting results, explain material differences, show liquidity, preserve restrictions, and provide a forward-looking view.
A good structure can be created in a spreadsheet, document, or fixed reporting format. The phrase nonprofit organization quarterly financial template pdf emphasizes presentation and distribution, while a spreadsheet-centered workflow emphasizes calculations and reconciliation. The underlying accounting logic should remain consistent regardless of the final presentation format.
For organizations that want a collaborative workflow, the phrase nonprofit organization quarterly financial template google sheets can describe a shared reporting structure. For a narrative board package, nonprofit organization quarterly financial template word may better describe the presentation layer. Neither format is inherently superior; the right choice depends on how the organization collects, reviews, approves, and communicates financial information.
The most important standard is reliability. A quarterly report should make it easier for leaders to understand what happened, why it happened, what could happen next, and what action is required. When the template is designed around those questions, quarterly reporting becomes an ongoing management discipline rather than a repetitive accounting exercise.
Reference Examples
A nonprofit organization quarterly financial Template is easiest to evaluate when readers can see how different financial reports organize the same underlying concepts. Useful visual references include statements of financial position, statements of activities, cash-flow statements, functional-expense schedules, operating budgets, and summary financial dashboards. These examples show how headings, categories, subtotals, comparative periods, restrictions, and management-focused summaries can be arranged without relying on one universal layout. A quarterly template should be adapted to the organization’s accounting basis, governance needs, funding structure, program model, and applicable reporting framework rather than copied without review.
The following visual references help illustrate the building blocks that can be combined into a practical nonprofit organization quarterly financial Template. Some focus on formal financial statements, while others show budget structures or reporting principles. Together, they demonstrate how financial information can move from detailed accounting records into concise management information. They are visual examples for evaluation and learning, not claims that every nonprofit must use the exact layouts shown. Local rules and organizational policies should always determine the final reporting structure.
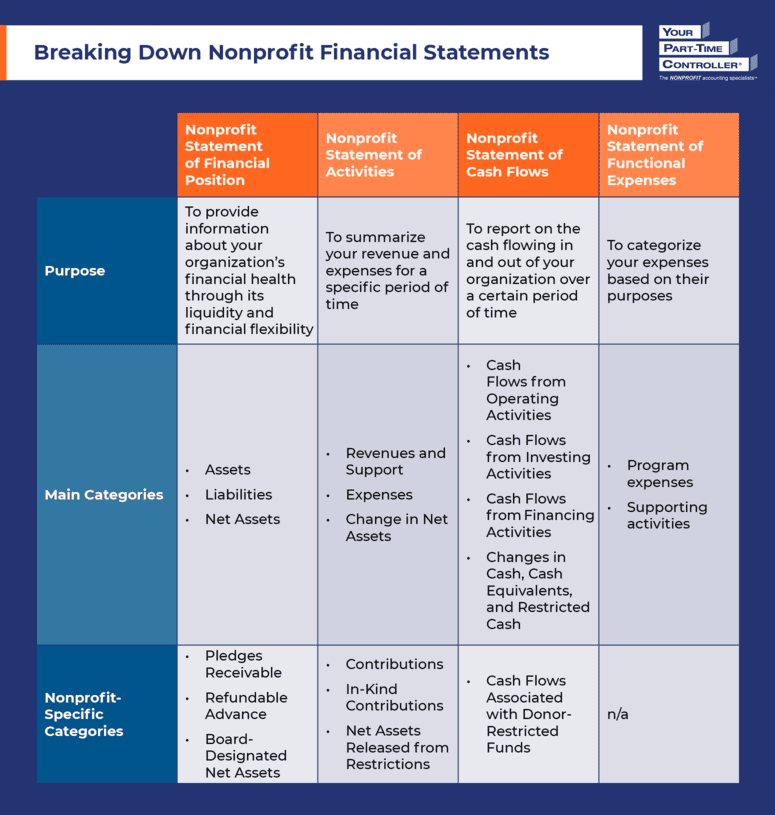
Breaking Down Nonprofit Financial Statements
Source: Your Part-Time Controller
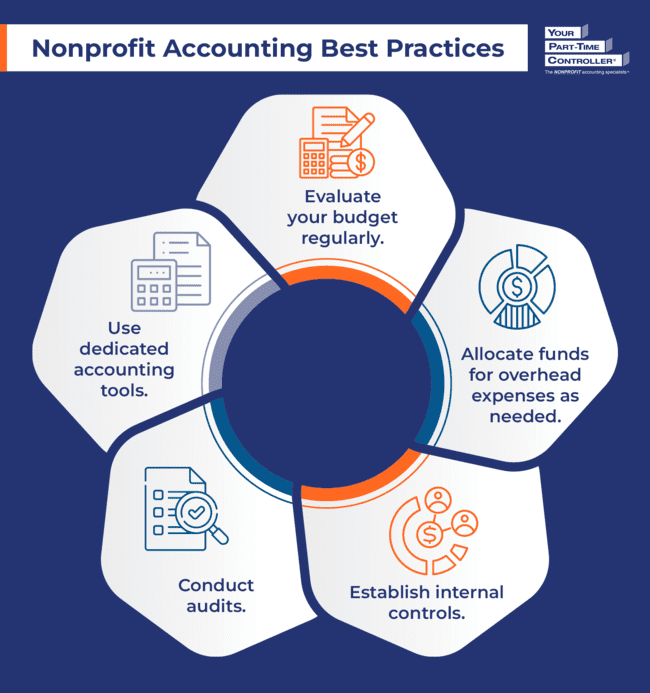
Nonprofit Accounting Best Practices
Source: Your Part-Time Controller
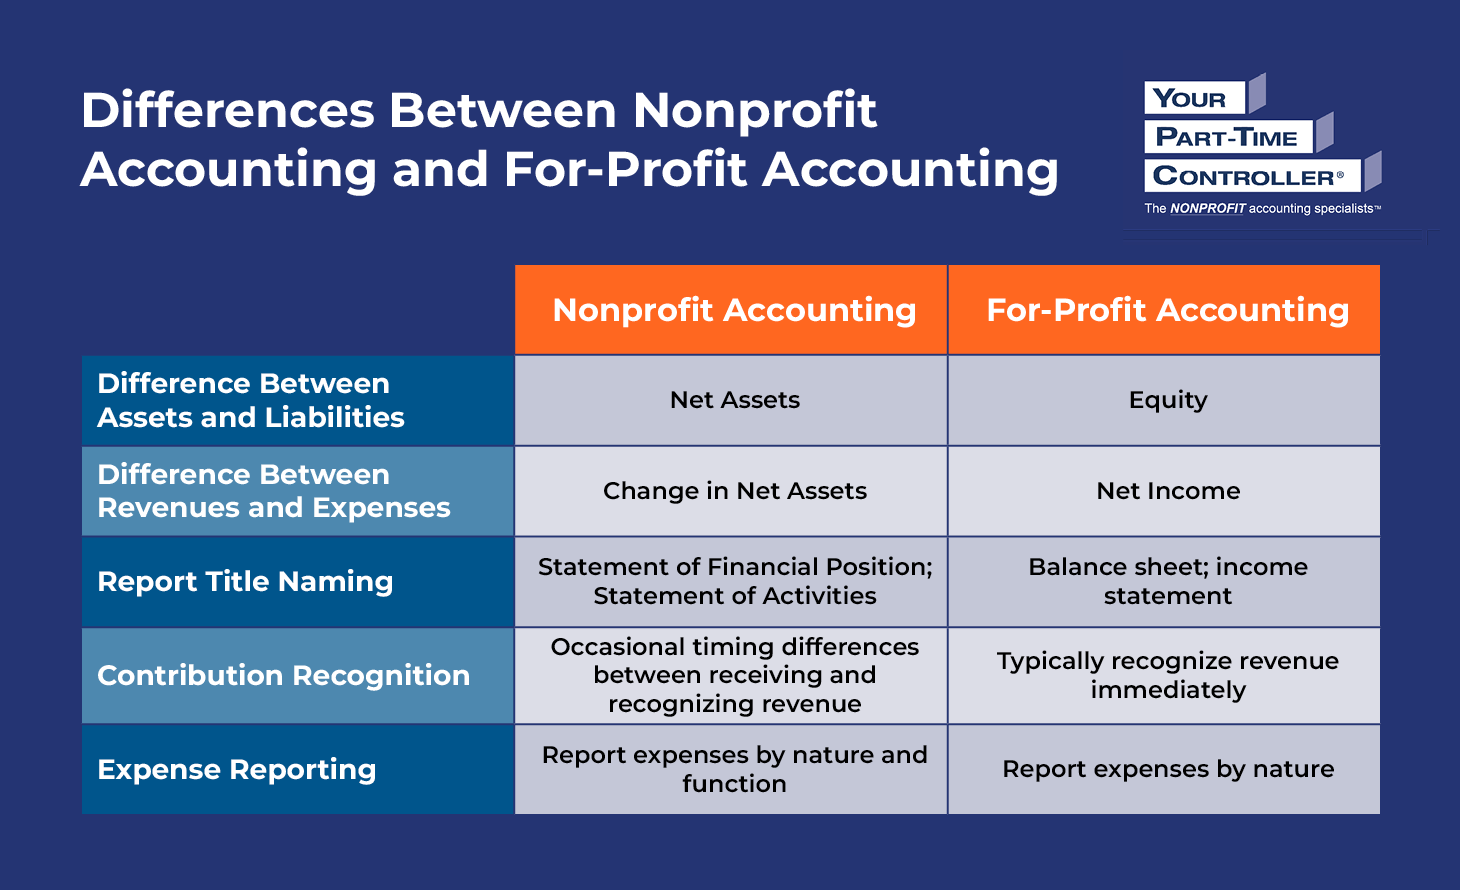
Differences Between Nonprofit Accounting and For-Profit Accounting
Source: Your Part-Time Controller
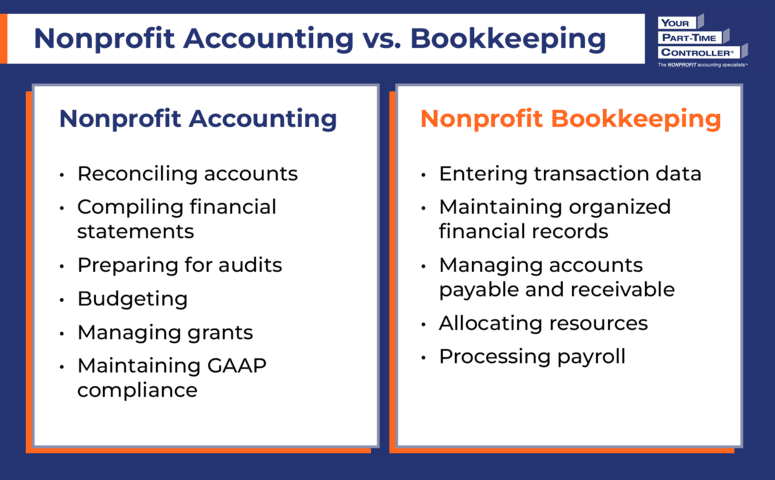
Nonprofit Accounting vs. Bookkeeping
Source: Your Part-Time Controller
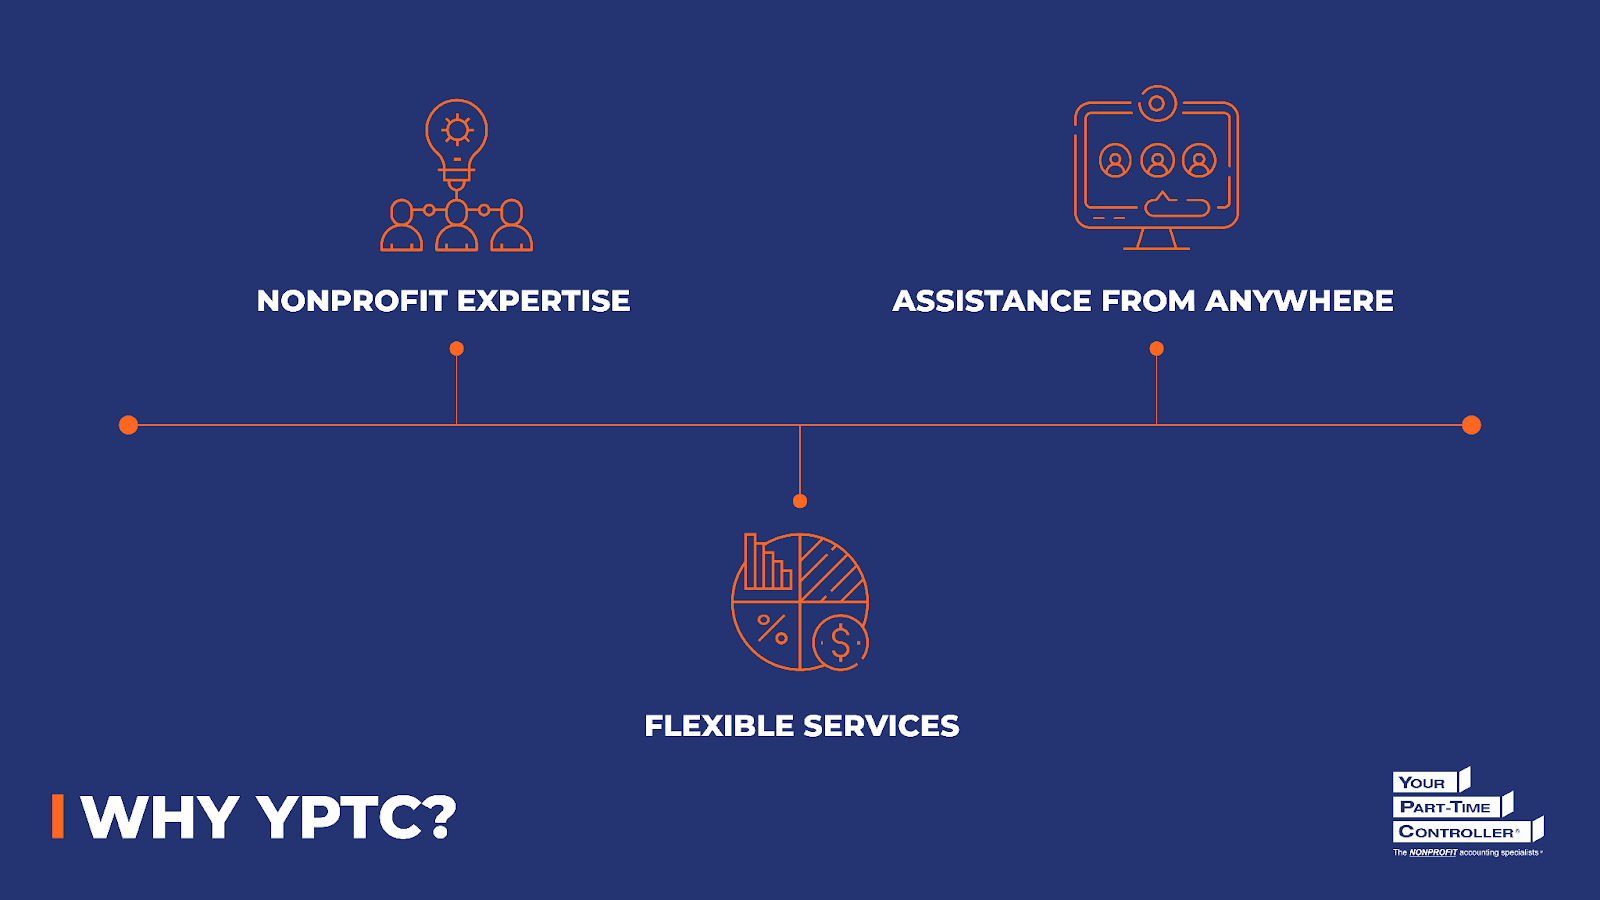
Why Nonprofit Accounting Expertise Matters
Source: Your Part-Time Controller

Benefits of Compiling Nonprofit Financial Statements
Source: Your Part-Time Controller
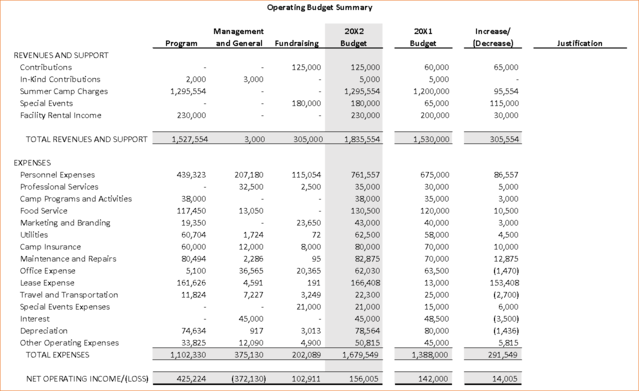
Operating Budget Summary
Source: Your Part-Time Controller
Statement of Financial Position
Source: Your Part-Time Controller
Statement of Activities
Source: Your Part-Time Controller
