The strongest dashboards are not simply attractive collections of charts. They are structured around business questions. A manager may need to know whether revenue is on plan, why operating costs changed, whether cash is tightening, or which business unit is affecting margin. The dashboard should make those questions easier to answer without forcing the reader to reconstruct the underlying analysis manually.
Microsoft describes a dashboard as a visual representation of key metrics that lets users view and analyze information in one place, while Excel dashboards can use PivotTables, PivotCharts, slicers, and timelines to support interactive analysis. :contentReference[oaicite:0]{index=0} A finance dashboard applies that principle to financial information, emphasizing metrics such as revenue, profit, expenses, cash, budget variance, and financial position.
This guide explains how to evaluate a template, what data belongs behind it, how to structure an Excel-based model, when Google Sheets or Power BI makes more sense, how to design executive-ready reporting, and how to avoid the common problems that make finance dashboards confusing or unreliable.
The examples below are illustrative rather than company-specific. Any numbers shown in an example should be treated as hypothetical unless explicitly identified as published sample data. The goal is to give you a reusable framework that can be adapted to a small business, finance department, FP&A team, controller’s office, startup, nonprofit, or larger organization.

What Is a Financial Dashboard Template?
A financial dashboard template is a pre-structured reporting layout containing placeholders for financial measures, charts, tables, comparisons, and filters. The template separates the presentation layer from the underlying financial data so that users can replace sample information with their own figures while keeping a consistent reporting structure.
A useful template normally contains a hierarchy rather than a random assortment of metrics. Headline KPIs appear first, trends appear next, analytical breakdowns follow, and detailed exceptions or supporting tables sit lower in the page. This hierarchy allows an executive to understand the overall position quickly while giving an analyst enough detail to investigate unusual results.
Typical headline measures include revenue, gross profit, operating profit, net income, cash balance, gross margin, net margin, and budget variance. Depending on the organization, the dashboard may also include accounts receivable, accounts payable, working capital, debt, inventory, operating cash flow, forecast revenue, or other management indicators.
The template should also establish definitions. For example, “revenue” should have a documented source and accounting definition, while “actual,” “budget,” and “forecast” should have clear meanings. Without consistent definitions, two dashboards can display different values for what appears to be the same KPI.
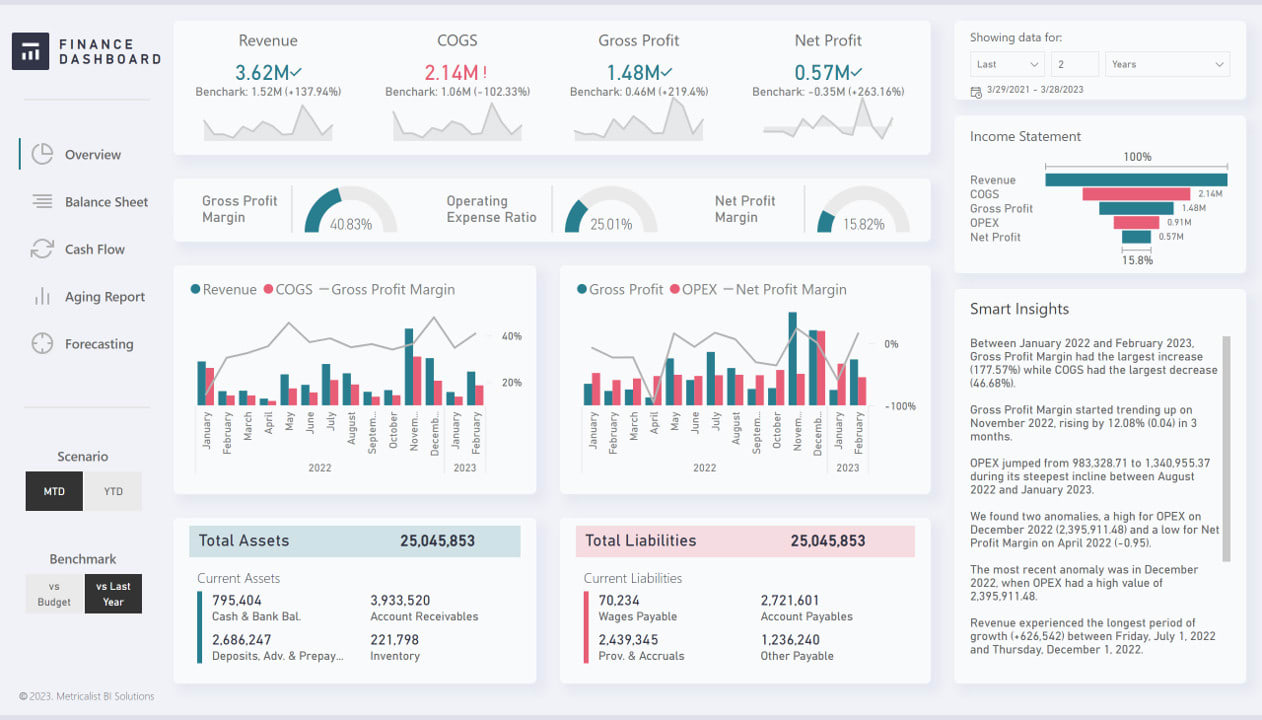
Microsoft’s Financial Overview report illustrates this principle by presenting measures such as revenue, net profit, net profit margin, assets, days sales outstanding, days sales of inventory, and days payable outstanding in a high-level finance view. :contentReference[oaicite:1]{index=1} The exact KPIs should vary according to the organization’s goals rather than being copied blindly.
Why Use a Sample Financial Dashboard Template?
Starting from a sample can reduce the design work required before meaningful analysis begins. Instead of deciding from scratch where every KPI, chart, filter, and comparison should go, the finance team can evaluate an existing structure and remove anything that does not support its reporting objectives.
A template can also improve consistency. If the monthly management review always presents revenue, gross margin, operating expenses, cash, and budget variance in the same locations, readers become familiar with the layout. Consistency reduces the mental effort required to interpret recurring reports.
Templates are particularly helpful when the underlying accounting data is complicated. A general ledger may contain thousands of transactions, dozens of account groups, several departments, and multiple reporting periods. The dashboard compresses that information into a management view while retaining the ability to drill into supporting analysis when necessary.
Another benefit is repeatability. A good model should allow the reporting period to change without rebuilding every chart. If January is replaced by February, the calculations and visualizations should update through formulas, PivotTables, Power Query, or a connected data model rather than manual copying.
Templates can also expose missing requirements. When a team sees revenue and expense charts side by side, it may recognize that cash flow, working capital, budget variance, or receivables aging is needed as well. The template therefore becomes a design conversation rather than merely a finished report.

Core Components of a Financial Dashboard
The first component is the KPI strip. It should answer the question, “Where are we now?” Revenue, profit, cash, margin, and budget variance are common choices, but the exact selection should reflect the dashboard’s purpose and audience.
The second component is trend analysis. A single revenue value is difficult to interpret without historical context. A monthly line or column chart can reveal seasonality, sustained growth, sudden deterioration, or a change in the relationship between revenue and expenses.
The third component is variance analysis. Actual results become much more useful when compared with a meaningful benchmark such as budget, forecast, prior month, prior year, or target. A variance should ideally show both the amount and percentage because a percentage alone can exaggerate small bases.
The fourth component is driver analysis. If operating expenses are above budget, the dashboard should help explain whether payroll, marketing, software, facilities, travel, procurement, or another category created the difference. A headline variance without a driver view often leads to unnecessary investigation.
The fifth component is exception reporting. Finance users often need to identify overdue receivables, unusual spending, large forecast changes, negative cash trends, or business units outside tolerance. A compact exception table can be more useful than another decorative chart.

What Data Should Sit Behind the Dashboard?
A dashboard is only as reliable as its data model. A practical finance model normally begins with transaction-level or summarized financial data containing dates, accounts, amounts, organizational dimensions, and scenario information.
Useful dimensions may include account, department, business unit, product, customer, vendor, region, legal entity, project, and reporting period. The more dimensions that are standardized, the easier it becomes to explain a variance without creating separate spreadsheets for every management question.
Scenario fields are equally important. A dashboard may need to distinguish actual results from budget, forecast, prior year, or another planning scenario. Keeping these scenarios clearly separated prevents accidental comparisons between incompatible figures.
Date handling deserves special attention. Finance models may use calendar years, fiscal years, quarters, months, weeks, or custom reporting periods. Every date should map consistently to the organization’s reporting calendar so that charts do not mix periods or produce misleading comparisons.
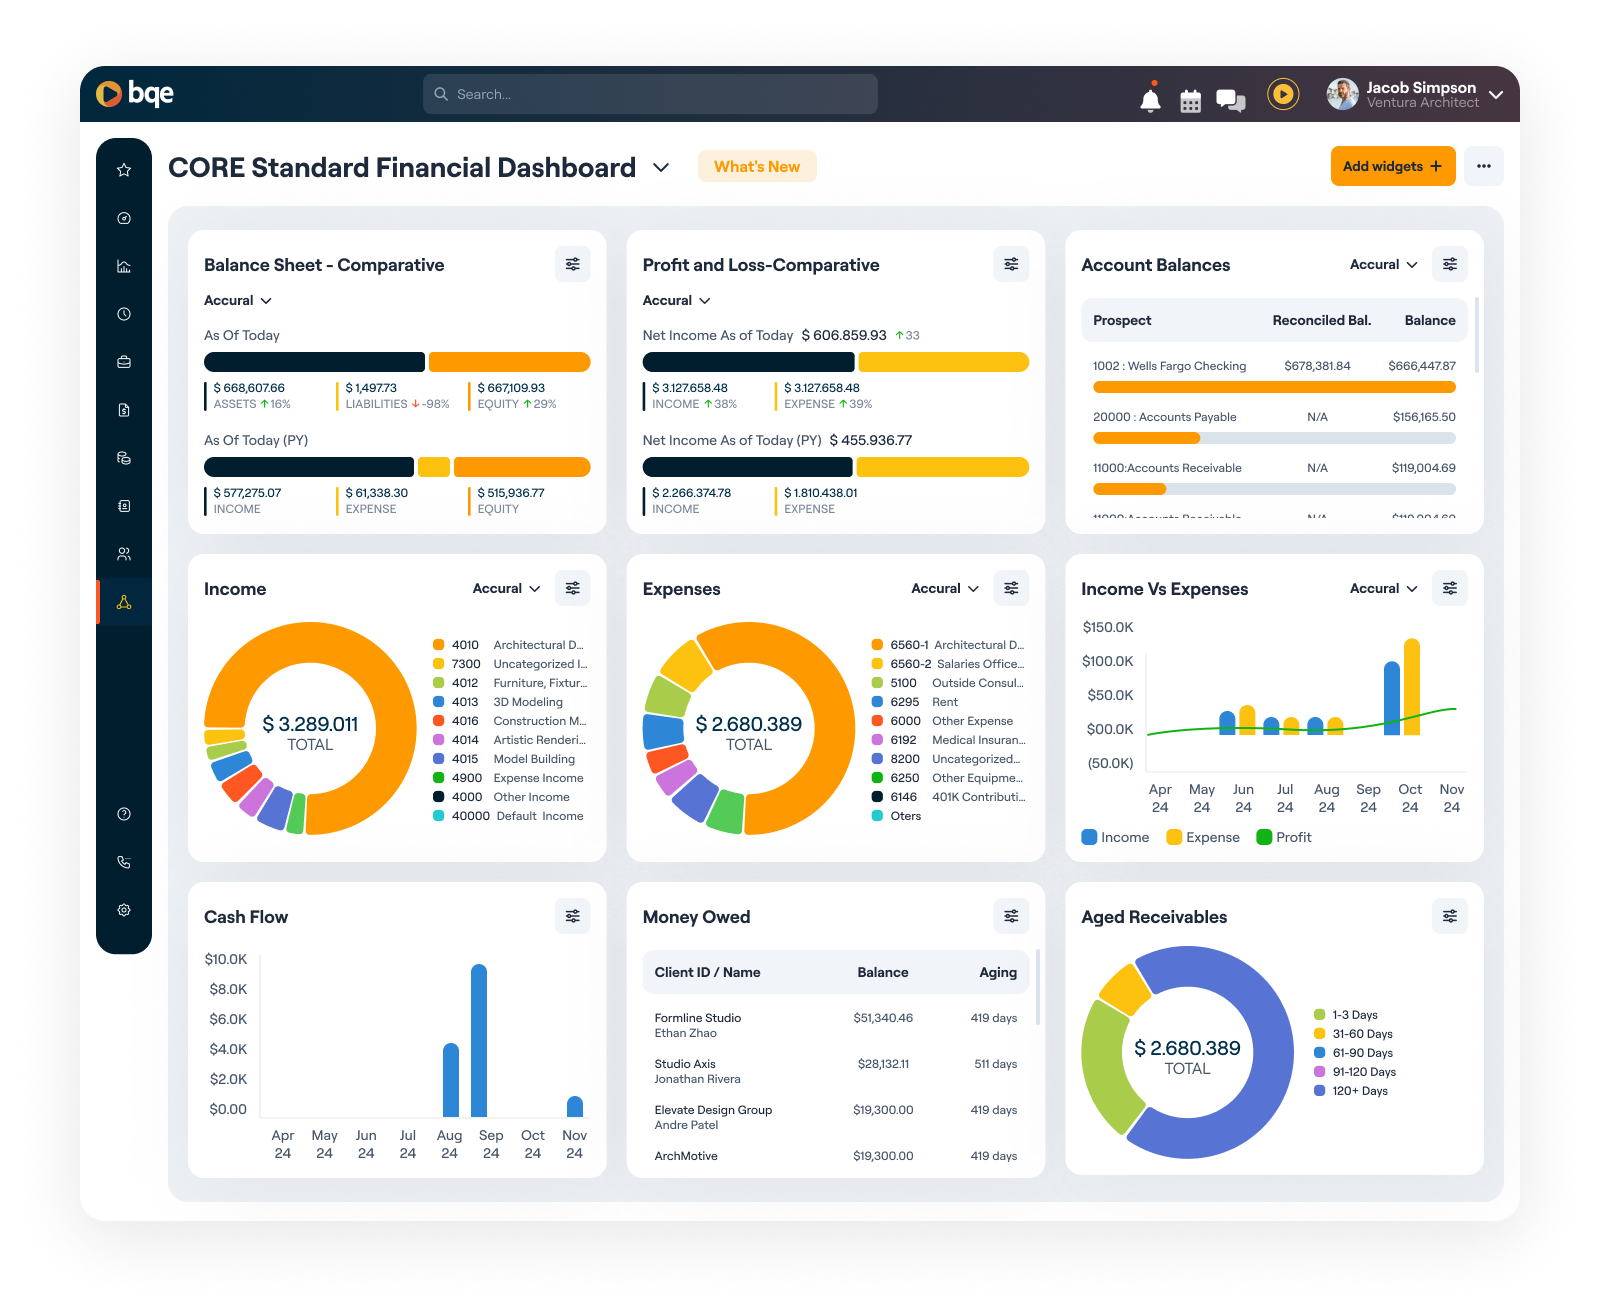
Microsoft’s Power BI financial sample uses sales and profit data organized by market segment and country or region, illustrating how financial analysis becomes more useful when measures can be examined across multiple dimensions rather than only as company-wide totals. :contentReference[oaicite:2]{index=2}
How to Structure a Financial Dashboard Workbook
A practical workbook should keep raw data, calculations, assumptions, and presentation separate. One common structure is a Data sheet, Mapping sheet, Calculations sheet, Dashboard sheet, and optional Detail or Checks sheet.
The Data sheet should contain the imported or manually maintained source table. It should avoid decorative formatting and merged cells because structured tables are easier for formulas, PivotTables, Power Query, and other tools to process.
The Mapping sheet can standardize account names into reporting groups. For example, individual general-ledger accounts might be mapped into Revenue, Cost of Sales, Payroll, Marketing, Facilities, Technology, and Other Operating Expenses.
The Calculations sheet should contain controlled formulas or summary tables. This layer is useful for calculating revenue growth, margins, variances, rolling averages, cash movements, and other derived measures before the results are visualized.
The Dashboard sheet should focus on communication. It should not become a giant calculation area. When users can separate the calculations from the presentation, troubleshooting becomes easier and the final dashboard is less likely to break when new data is added.
Sample Financial Dashboard Template Excel Design
A strong Excel design starts with a structured transaction table. A simple example might contain Date, Account, Category, Department, Description, Scenario, Amount, and Reporting Period columns. Each row represents one financial record or another consistently defined reporting observation.
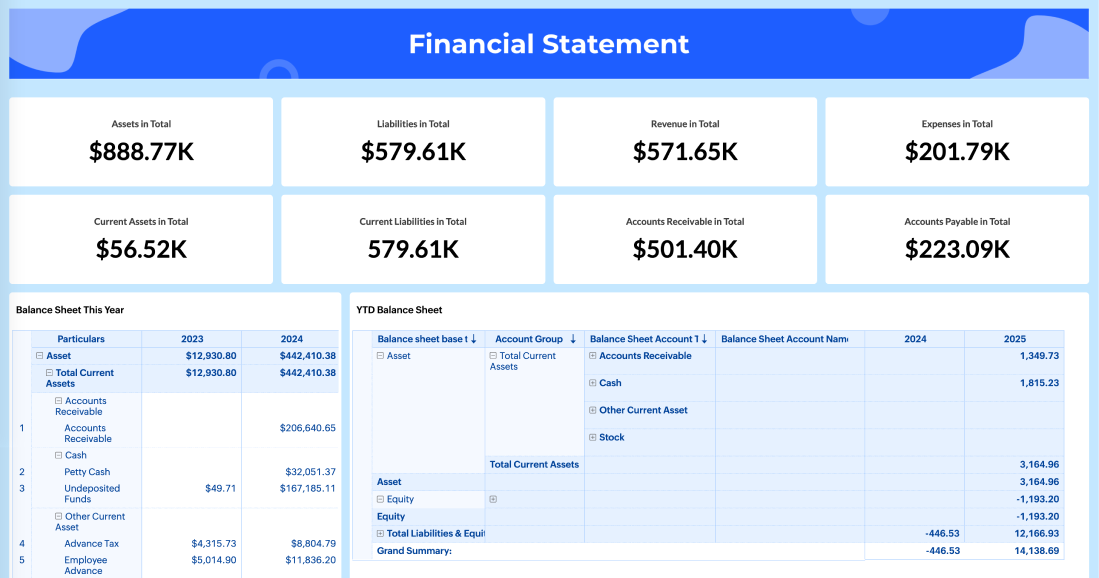
Once the source table is structured, Excel can summarize it using formulas or PivotTables. SUMIFS can aggregate values by category and period, while PivotTables can provide flexible summaries for dimensions such as department, region, product, or account group.
For recurring reporting, Power Query can be useful when data arrives from accounting exports that need the same cleaning steps every month. Microsoft recommends preparing and connecting data through Excel tables and Power Query before creating dashboards, which helps establish a consistent source for repeatable reporting. :contentReference[oaicite:3]{index=3}
The visual layer can then contain KPI cards, line charts, column charts, variance tables, and filters. Slicers are particularly useful when users need to change the view by period, department, region, or another dimension without manually changing formulas.
A practical Excel dashboard should also include a small reconciliation area. For example, the total revenue shown on the dashboard should be traceable to the source data, and the balance sheet should reconcile according to the accounting logic used by the model. This simple control can prevent attractive but unreliable reports.

How to Build the Dashboard Step by Step
Step 1: Define the decisions. Start with the decisions the dashboard should support. A cash-management dashboard will prioritize liquidity and payment timing, while an executive performance dashboard may prioritize revenue, margin, profit, cash, and budget variance.
Step 2: Select KPIs. Limit the top row to measures that genuinely matter. If every available KPI is displayed, none receives enough attention. A useful rule is to place only the metrics that can change a management decision in the headline area.
Step 3: Establish definitions. Document formulas, source systems, reporting periods, currency, scenario definitions, and treatment of unusual items. This step is especially important when several people contribute to the dashboard.
Step 4: Clean the source data. Standardize dates, account categories, department names, currencies, scenario labels, and missing values. Check for duplicate records and confirm that sign conventions are consistent.
Step 5: Build calculations. Create the summary tables that feed the visual layer. Keep calculation logic visible enough that another analyst can audit it rather than hiding critical formulas inside dozens of charts.
Choosing the Right Charts
Line charts work well for trends such as monthly revenue, operating cash flow, gross margin, or net profit. The horizontal axis should normally represent time, and the number of lines should remain limited enough that the reader can distinguish them easily.
Column charts are useful for comparing categories or periods. They can show actual versus budget by department, revenue by business unit, or expenses by category. When there are many categories, a horizontal bar chart is often easier to read.
Waterfall charts are valuable when the story concerns movement from one financial position to another. For example, a bridge can explain how revenue becomes operating profit by showing the effect of major cost groups.
Tables remain important. Finance professionals often need exact values, not just visual impressions. A compact table can show budget, actual, variance, and variance percentage while charts provide the surrounding context.
Pie and doughnut charts should be used selectively. They can communicate a simple composition with a small number of categories, but comparing several similarly sized slices is generally harder than comparing bars with a shared scale. Chart selection should always follow the analytical question.

Budget Versus Actual Analysis
Budget-versus-actual analysis is one of the most practical uses of a finance dashboard. The basic comparison is straightforward: actual performance is measured against the approved budget for the same reporting period.
For revenue, a positive variance may generally be favorable, although the interpretation depends on the business context. For expenses, a positive spending variance may be unfavorable when it represents overspending. Therefore, dashboards should label variances clearly rather than assuming that a positive number always means good performance.
A useful dashboard can show monthly variance, year-to-date variance, and full-year outlook. It can then rank the largest favorable and unfavorable movements so managers can focus on the areas that require explanation.
Microsoft’s Actual vs. Budget reporting examples demonstrate the value of comparing actual purchase amounts with budget amounts and exposing both variance amounts and variance percentages. :contentReference[oaicite:4]{index=4} The same principle can be applied to operating expenses, revenue, headcount costs, capital spending, or other controlled financial categories.
For example, suppose a hypothetical department has a monthly marketing budget of $50,000 and actual spending of $62,000. The dashboard should not stop at showing a $12,000 unfavorable variance. It should help identify whether the difference came from advertising, software, events, contractors, or timing.

Cash Flow and Liquidity Views
Profit and cash are related but not identical. A business can report accounting profit while experiencing cash pressure because customers have not paid invoices, inventory has increased, debt repayments are due, or other cash movements occur outside the immediate profit calculation.
A cash-focused dashboard should therefore show opening cash, inflows, outflows, closing cash, and where appropriate a short-term forecast. The most useful period depends on the business, but consistency matters more than a particular horizon.
Accounts receivable can be incorporated through aging categories such as current, 1–30 days, 31–60 days, 61–90 days, and older balances. This can help finance teams distinguish between total receivables and amounts that may require collection attention.
Working capital indicators can add another layer of context. Current assets, current liabilities, receivables, payables, inventory, and turnover measures can help explain why liquidity is improving or deteriorating.
A finance dashboard should avoid presenting a single cash number without its trend. The direction of cash movement, expected receipts, scheduled payments, and unusual items often provide more actionable information than the current balance alone.

Revenue and Profitability Analysis
Revenue is usually the starting point for performance analysis, but revenue alone does not show whether growth is economically attractive. A dashboard should connect revenue with cost of sales, gross profit, operating expenses, and net income where appropriate.
Gross margin is especially useful when management needs to understand whether changes in revenue are accompanied by changes in profitability. A business can grow sales while margins decline, creating a very different financial situation from profitable growth.
Revenue can also be segmented by product, customer, region, channel, or business unit. This helps identify concentration and mix effects. If total revenue is stable but one product grows while another contracts, the headline number may conceal an important strategic change.
Profitability dashboards should also distinguish actual performance from target performance. A business unit that generates the largest absolute profit may not have the strongest margin, while a smaller unit could have superior economics.
Microsoft’s Customer Profitability sample demonstrates how dashboards can combine company-level measures with business-unit, customer, product, and margin analysis, allowing users to move from a high-level result toward the factors affecting profitability. :contentReference[oaicite:5]{index=5}

Forecasting and Scenario Analysis
A dashboard becomes more valuable when it can show where current performance may lead. Forecasting does not require pretending that future results are certain. Instead, it provides a structured way to test assumptions and understand potential consequences.
A basic forecast may project revenue, operating expenses, and cash for upcoming periods. A more advanced model can include business-unit assumptions, pricing changes, headcount plans, seasonal patterns, customer retention, capital spending, or other drivers relevant to the organization.
Scenario analysis can present a base case, conservative case, and growth case. The important point is to document the assumptions behind each scenario. A forecast without visible assumptions can create false confidence because readers may mistake a model output for a guaranteed outcome.
Actual-versus-forecast analysis is another useful view. When actual results diverge from the forecast, the dashboard can identify whether the difference came from volume, price, timing, cost, customer mix, or another driver.
Forecasting dashboards should therefore be treated as management tools rather than prediction machines. Their primary value is helping teams recognize emerging pressure, understand trade-offs, and update decisions as new information arrives.

Sample Financial Dashboard Template Free: What to Look For
When evaluating a free template, start with the data structure rather than the appearance. A beautiful dashboard with hard-coded figures is less useful than a plain dashboard whose calculations are transparent and easy to update.
Look for templates that clearly separate inputs from outputs. You should be able to identify where source data belongs, where assumptions are entered, where calculations occur, and which cells feed the charts.
Check whether the template handles multiple reporting periods. A dashboard designed only for one month may require substantial rebuilding, whereas a properly structured model should support monthly, quarterly, and year-to-date views.
Also check whether the template can accommodate your organization’s dimensions. If you need department and region analysis but the template only supports company totals, its usefulness may be limited regardless of how professional the design looks.
Finally, test the template with a small controlled dataset before using it for management reporting. Confirm that totals reconcile, filters work correctly, formulas update as expected, and the visual labels remain understandable after replacing the sample information.

Sample Financial Dashboard Template for Business Use
A small business may need a simpler dashboard than a multinational organization. For an owner-managed company, the most important view could be monthly revenue, operating expenses, net profit, cash balance, accounts receivable, and budget or target performance.
A larger company may need consolidation across entities, currencies, departments, regions, and business units. In that environment, the dashboard should be supported by a controlled reporting hierarchy and a consistent chart of accounts mapping.
Project-based organizations may need project revenue, project cost, gross margin, unbilled work, receivables, and forecast completion. Retail businesses may emphasize sales, gross margin, inventory, store performance, and working capital.
SaaS businesses may add recurring revenue, retention, customer acquisition economics, and cash runway. These metrics should supplement, not replace, core financial reporting when management needs a complete view of profitability and liquidity.
The correct design therefore depends on the decisions the dashboard must support. There is no universally perfect finance dashboard. A template becomes useful when its structure matches the organization’s operating model and reporting responsibilities.
Sample Financial Dashboard Template Google Sheets Approach
Google Sheets can be appropriate when a small team needs collaborative access to a relatively straightforward financial model. Its cloud-based collaboration can make it convenient for teams that need several people to review or update planning information.
A Sheets-based model should still follow the same principles as an Excel model: structured source data, controlled calculations, consistent definitions, and a dedicated presentation layer. Collaboration does not eliminate the need for financial controls.
Separate input ranges from calculated ranges and protect formulas where appropriate. Use data validation for fields such as departments, scenarios, categories, and reporting periods so that contributors do not create slightly different labels for the same concept.
For a collaborative budget, a useful structure may include an assumptions tab, detailed input tab, calculation tab, dashboard tab, and checks tab. Each contributor can work within defined areas while the dashboard pulls results into one shared view.
Google Sheets becomes less attractive when the model grows very large, requires complex transformations, needs strict enterprise governance, or must integrate with many operational systems. At that point, a dedicated BI or finance analytics architecture may be more appropriate.
Sample Financial Dashboard Template Free Download: Evaluate Before You Use
The phrase “free download” does not automatically mean a template is suitable for professional reporting. Before adopting any downloadable resource, inspect its formulas, source structure, documentation, and update process.
Check whether sample figures are clearly distinguishable from live data. A common implementation mistake is replacing some sample values while leaving others behind, causing the dashboard to combine real and illustrative information.
Review hidden sheets and formulas if you are comfortable doing so. Important calculations should be understandable enough to validate. A finance team should not depend on a template containing unexplained formulas that nobody internally owns.
Also consider licensing and usage terms before redistributing a downloaded template. A resource can be useful for inspiration without necessarily granting permission to republish its original design or assets.
Microsoft provides official financial sample workbooks for Power BI and describes how they can be loaded into Power BI Desktop, making official sample data a useful learning option when you want to study the relationship between source data and a dashboard. :contentReference[oaicite:6]{index=6}
Sample Financial Dashboard Template Power BI
Power BI becomes particularly useful when financial reporting needs interactive exploration, multiple data sources, semantic modeling, and drill-down analysis. Instead of treating the dashboard as a formatted spreadsheet, Power BI allows the reporting model and visual layer to work together.
A typical workflow starts by importing financial data, preparing it, establishing relationships, defining measures, creating visuals, and publishing the resulting report. Microsoft describes this sequence in its tutorial for creating a Power BI report from an Excel workbook. :contentReference[oaicite:7]{index=7}
Power BI can also support multiple levels of analysis. An executive may begin with total revenue and net profit, then select a business unit, region, customer group, or product to understand what is driving the result.
The data model is critical. A visually impressive report can still produce incorrect results if relationships, date tables, account mappings, or measures are poorly designed. Financial dashboards require stronger validation than ordinary descriptive charts because users may rely on them for consequential decisions.
Microsoft’s Financial Overview and Customer Profitability examples demonstrate how Power BI can organize financial KPIs, business dimensions, and supporting analysis into interactive reporting experiences rather than static snapshots. :contentReference[oaicite:8]{index=8}
Designing Dashboard Financial Reporting Templates
Financial reporting should tell a coherent story. A useful sequence is current performance, comparison with target, trend, driver, and exception. This lets the reader move naturally from “what happened?” to “how different was it?” and finally to “why did it happen?”
The first screen should not attempt to reproduce the entire income statement. Instead, it should summarize the most important financial signals and provide pathways to detail.
Use consistent number formats. If revenue is shown in millions, avoid switching to raw units on another chart without a clear reason. Currency, decimal precision, percentages, and negative-number conventions should also remain consistent.
Use titles that explain the analytical purpose. “Revenue Trend” is better than “Chart 1,” while “Actual Revenue vs Budget by Month” communicates even more clearly what the reader is seeing.
Most importantly, design the dashboard for its audience. Executives usually need concise indicators and exceptions, finance analysts need drivers and reconciliations, and department managers need information specific to the areas they control.
Samples of Financial Dashboards: What Good Examples Have in Common
Good dashboard samples tend to share a clear visual hierarchy. Important KPIs are prominent, trends are easy to follow, and detailed information is available without overwhelming the opening view.
They also make comparisons explicit. Instead of showing a standalone $5 million revenue figure, an effective dashboard might show the current value alongside budget, prior year, or another meaningful reference point.
Strong examples also provide context for unusual results. A sudden expense increase should lead the user toward a category, department, vendor, or other driver that explains the movement.
Interactivity should serve analysis rather than decoration. Filters, slicers, drill-through pages, and dynamic selections are valuable when they answer real questions. They are unnecessary when they merely add complexity.
Finally, good samples respect the difference between reporting and analysis. Reporting communicates the controlled result, while analysis helps users investigate the factors behind it. The best dashboards connect these two activities without confusing their purposes.
Example of Financial Dashboard Layout
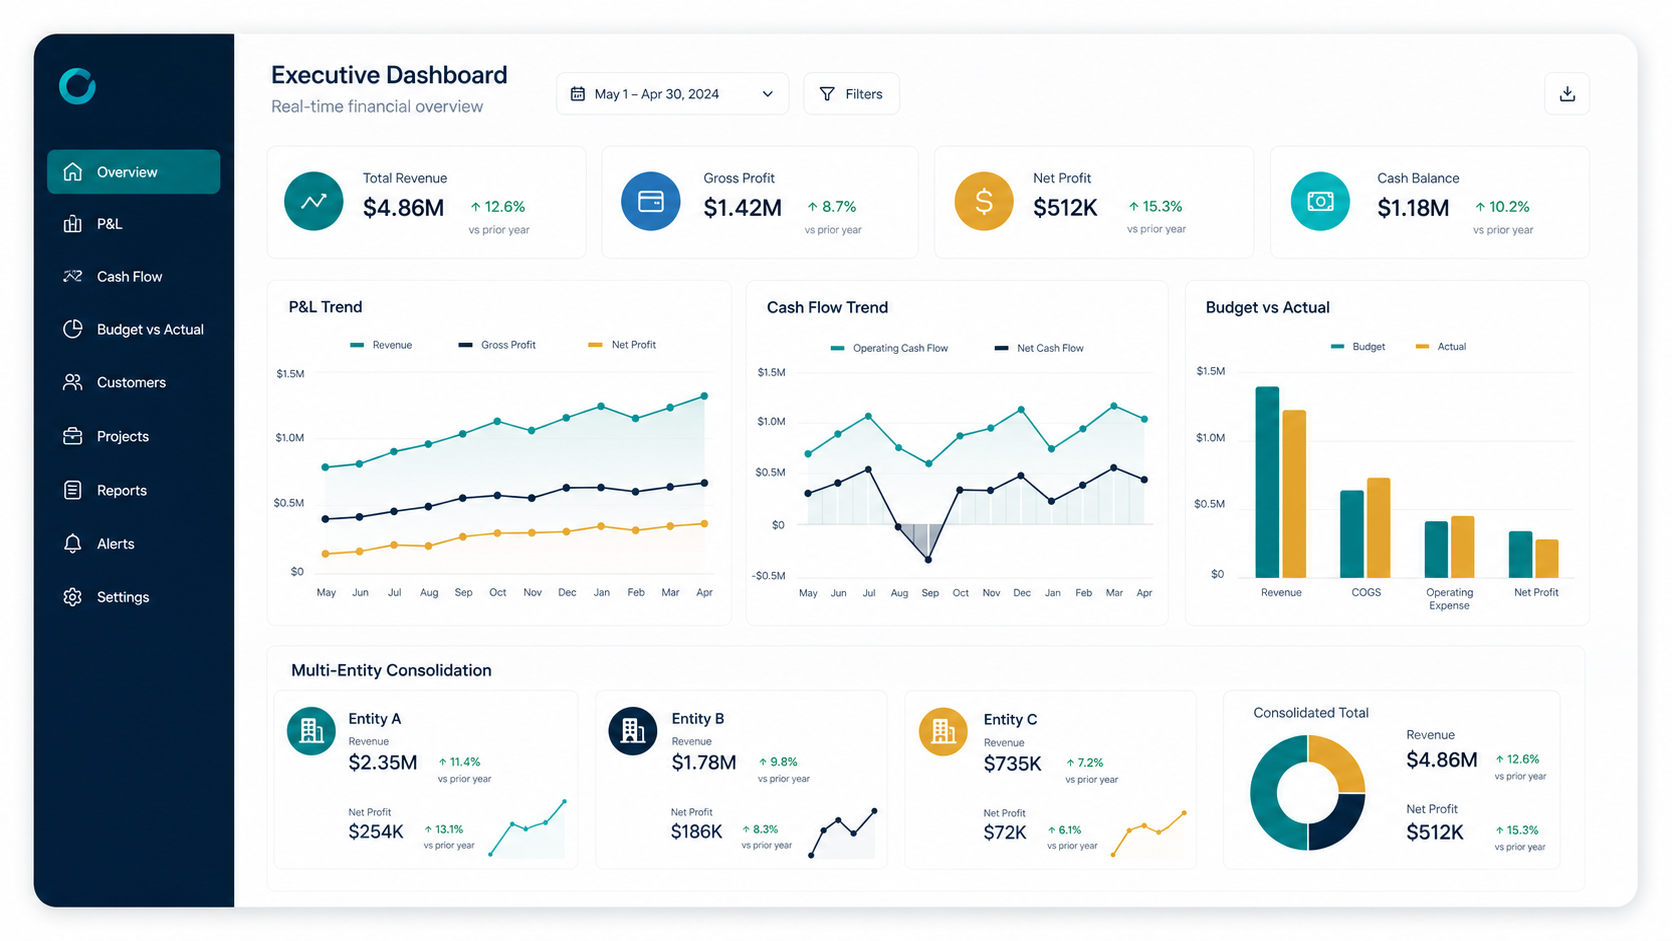
A practical executive layout might begin with six KPI cards: revenue, gross profit, operating profit, net profit, cash, and budget variance. These are illustrative choices rather than universal requirements.
The second row could contain a revenue-versus-budget trend, gross-margin trend, and operating-expense trend. This section answers whether current performance is moving in the desired direction.
The third row could contain a profitability bridge, expense category ranking, and revenue contribution by business unit. These views explain what is influencing the headline results.
A final section could list exceptions such as large unfavorable variances, overdue receivables, significant forecast changes, or unreconciled balances. The dashboard then becomes an action-oriented review tool rather than a passive collection of metrics.
This structure is flexible enough to adapt to different organizations while maintaining a logical flow from summary to explanation. The layout should remain visually calm, with enough white space to distinguish sections and prevent competing visual elements from dominating attention.
Common Financial Dashboard Mistakes
Mistake 1: Too many KPIs. Displaying every available measure creates noise. A dashboard should prioritize the measures that influence decisions, while secondary indicators can remain available on detail pages.
Mistake 2: No benchmark. A number without context is difficult to interpret. Whenever possible, compare actual performance with budget, forecast, prior period, prior year, or another clearly defined target.
Mistake 3: Mixing accounting and management definitions. If one chart uses a management definition of operating expense and another uses the general-ledger classification, users may see apparently contradictory results.
Mistake 4: Hard-coded charts. A dashboard that requires manual range changes every month is difficult to maintain. Structured tables, PivotTables, Power Query, or connected data models can reduce recurring maintenance.
Mistake 5: Ignoring data quality. Missing dates, inconsistent account mappings, duplicated transactions, incorrect signs, and incomplete actuals can undermine the dashboard regardless of how polished the design appears.
Best Practices for Professional Finance Dashboards
Keep the data model simple enough to understand and robust enough to support the required analysis. Complexity should exist because the business requires it, not because the dashboard was built without a clear structure.
Use a controlled KPI dictionary. For every major metric, record its definition, formula, source, reporting frequency, owner, and any important exclusions. This documentation can prevent arguments about whose number is correct.
Build reconciliation checks into the model. Total revenue, expenses, assets, liabilities, cash, and other important measures should be checked against authoritative sources at appropriate stages of the reporting process.
Separate data refresh from interpretation. The dashboard should update reliably, but users should still review unusual movements rather than assuming every automated result is correct.
Review the dashboard periodically. If a chart has not influenced a decision for months, consider removing it. A smaller dashboard that consistently supports management action is generally more useful than a large dashboard that nobody reads carefully.
Practical Solution: Build a Reusable Finance Dashboard Workflow
The most practical solution is to treat the dashboard as the final stage of a controlled reporting workflow. Begin with a single agreed source of financial data rather than collecting numbers manually from multiple files whenever a report is requested.
1. Create a standardized source table. Establish consistent columns for date, account, amount, department, business unit, scenario, and reporting period. Add dimensions only when they are genuinely needed for analysis.
2. Create a financial mapping layer. Map detailed accounts into management categories such as revenue, cost of sales, payroll, marketing, facilities, technology, and other expenses. Keep the mapping separate so changes can be reviewed.
3. Define the KPI calculations. Document revenue, gross profit, operating profit, margins, cash flow, variance, and other selected metrics. Use the same definitions everywhere in the dashboard.
4. Build actual, budget, and forecast comparisons. Make sure the periods align. A March actual should be compared with March budget or the appropriate March forecast, not an unrelated reporting period.
5. Create the executive view. Place the most important KPIs at the top, trends underneath, drivers next, and exceptions at the bottom. Avoid filling every available space with a chart.
6. Add analytical detail. Provide department, product, customer, region, account, or project breakdowns where they support real investigation. Use filters or drill-downs to keep the opening view concise.
7. Add reconciliation checks. Compare dashboard totals with authoritative reports before publication. Keep the checks accessible to the finance team even if they are hidden from the executive presentation.
8. Establish a reporting rhythm. Decide when data refreshes, who reviews the dashboard, who investigates exceptions, and when the executive version is distributed. A dashboard becomes useful when it is embedded into a repeatable decision process.
9. Control access. Financial dashboards can contain confidential information. Users should receive only the level of detail appropriate for their responsibilities, especially where payroll, customer information, vendor information, or other sensitive business data is involved.
10. Improve based on decisions. After several reporting cycles, ask which metrics generated action. Keep those prominent, simplify unused elements, and add new measures only when there is a clear analytical need.
This workflow works whether the presentation layer is Excel, Google Sheets, Power BI, or another reporting platform. The technology changes, but the fundamental requirements remain the same: trustworthy data, clear definitions, appropriate comparisons, useful visualizations, and controlled reporting.
Reference Examples
The following examples illustrate different ways financial dashboards can present profitability, reporting, forecasting, risk, valuation, and management information. They are visual references rather than recommendations that every business should reproduce exactly.
sample financial dashboard template

Source: Qlik
sample financial dashboard template excel
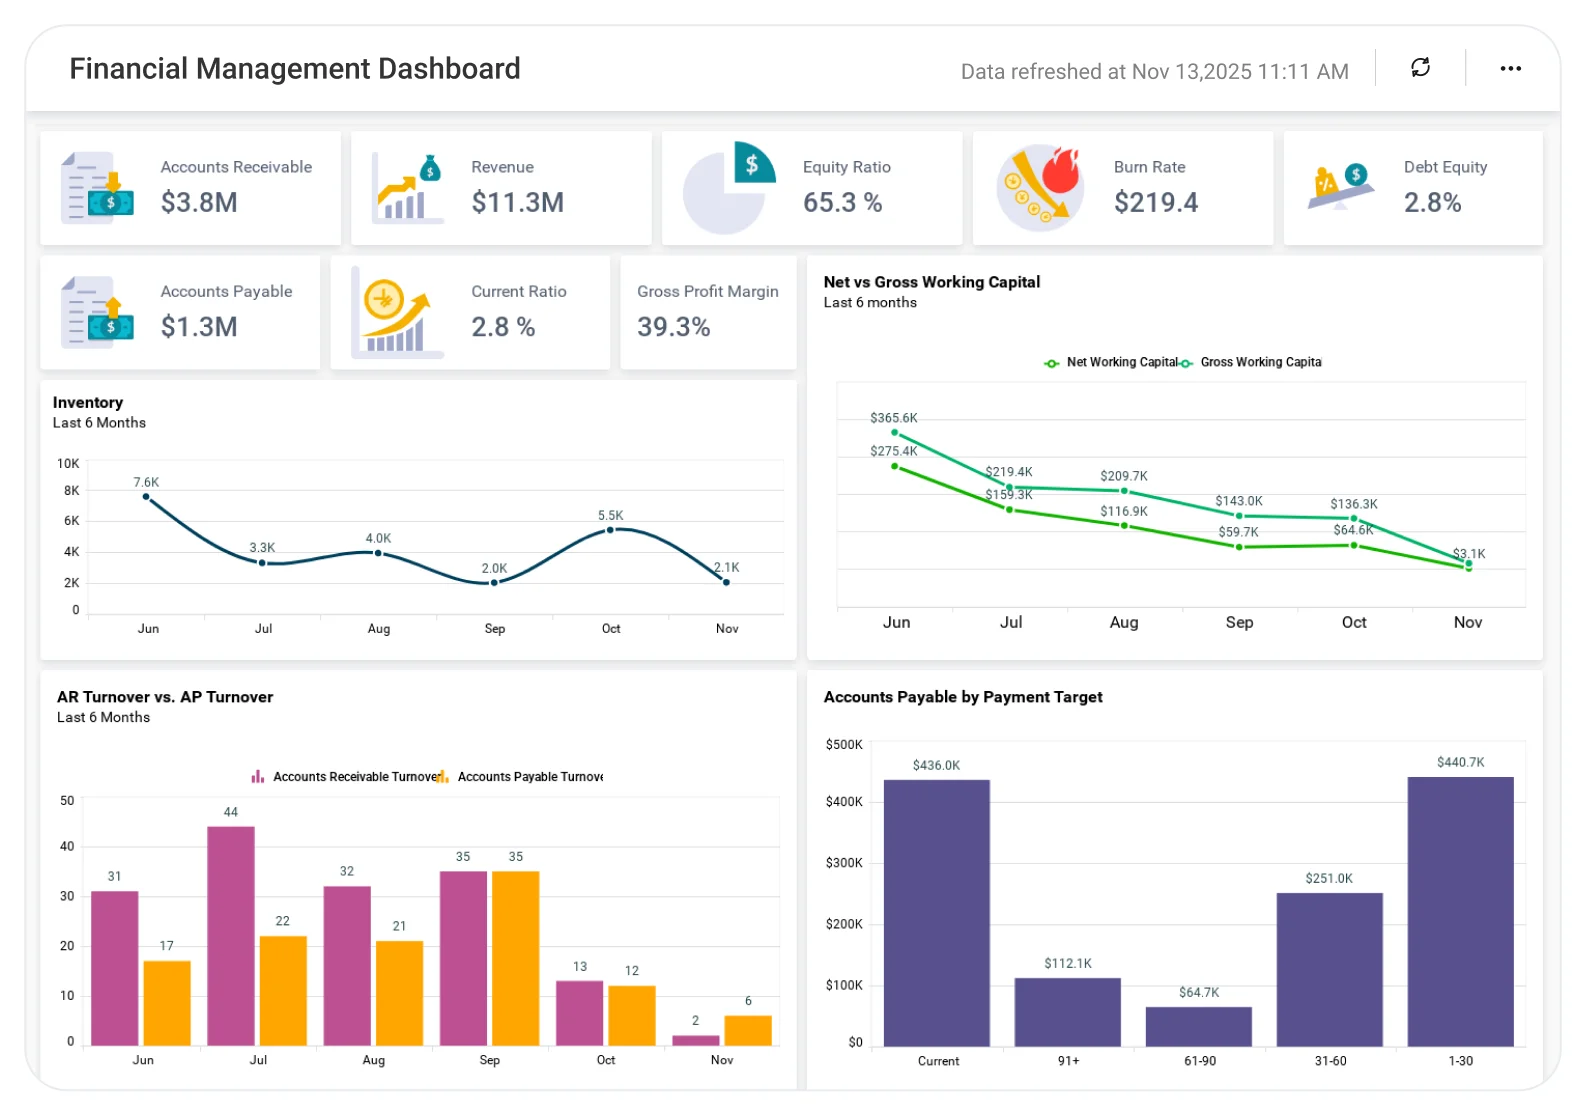
Source: Bold BI
sample financial dashboard template free
Source: Bold BI
sample financial dashboard template for business

Source: Qlik
sample financial dashboard template google sheets

Source: Bold BI
sample financial dashboard template free download

Source: RowSpeak
sample financial dashboard template power bi

Source: Qlik
free financial dashboard excel template

Source: Qlik
sample excel dashboard templates for finance

Source: Qlik
dashboard financial reporting templates

Source: Qlik
financial dashboard powerpoint template

Source: Qlik
samples of financial dashboards

Source: Qlik
example of financial dashboard

Source: Qlik
sample dashboard for financial reporting
Source: Qlik
sample finance dashboards
Source: Qlik
Frequently Asked Questions
What should a sample financial dashboard template include?
A practical template usually includes headline KPIs, period trends, budget or forecast comparisons, profitability measures, cash or liquidity indicators, supporting breakdowns, and an exception or detail area. The exact selection should match the decisions the dashboard is designed to support.
Is Excel good for a financial dashboard?
Yes. Excel can be very effective for small and medium reporting models, particularly when the data is structured and the dashboard uses tables, formulas, PivotTables, PivotCharts, slicers, and repeatable refresh processes. It becomes more challenging as data volume, integration requirements, governance, and interactive analysis needs increase.
When should a business use Power BI instead of Excel?
Power BI is worth considering when the organization needs a governed data model, multiple connected sources, interactive exploration, reusable measures, role-based reporting, or dashboards that scale beyond a conventional workbook. Microsoft provides tutorials showing how Excel financial data can be transformed into Power BI reports. :contentReference[oaicite:9]{index=9}
Can a financial dashboard be built in Google Sheets?
Yes. Google Sheets can support collaborative finance dashboards when the model is reasonably simple. The same fundamentals still apply: structured data, controlled formulas, consistent definitions, clear permissions, and regular validation.
What are the most important financial dashboard KPIs?
Common choices include revenue, gross profit, operating profit, net profit, margins, cash flow, cash balance, budget variance, accounts receivable, accounts payable, and working capital. CFO-focused dashboards may also include measures such as return on assets, return on equity, debt-to-equity, cash conversion cycle, DSO, and DPO. :contentReference[oaicite:10]{index=10}
How many charts should a finance dashboard have?
There is no universal number. The better approach is to use the fewest visuals necessary to answer the dashboard’s key questions. A concise executive dashboard might need only several KPI cards and a handful of charts, while an analyst-facing report can provide more detailed pages and drill-downs.
What is the difference between a dashboard and a financial report?
A financial report traditionally presents structured information for a defined reporting period, while a dashboard emphasizes visual monitoring, comparison, interaction, and rapid interpretation. They can complement each other: the dashboard provides management context while detailed financial reports provide supporting information.
How can I make a dashboard trustworthy?
Use authoritative source data, document KPI definitions, reconcile totals, control access, separate inputs from calculations, test refresh processes, and maintain an audit-friendly calculation structure. A visually polished dashboard should never be considered reliable until its underlying numbers have been validated.
Conclusion
A sample financial dashboard template is most valuable when it provides more than a collection of attractive charts. It should create a repeatable path from source data to trusted KPIs, comparisons, trends, drivers, exceptions, and management action.
The strongest approach is to begin with business questions, define the required metrics, structure the financial data, build transparent calculations, and then design the visual layer. Excel remains a practical choice for many reporting models, Google Sheets can work well for collaborative and simpler use cases, and Power BI becomes increasingly valuable when data integration, modeling, interactivity, and governance requirements grow.
Whether the goal is monthly management reporting, budget monitoring, cash-flow oversight, profitability analysis, or executive review, the same principles apply: consistent definitions, aligned periods, meaningful comparisons, clean source data, appropriate visualization, and reliable reconciliation.
The best template is therefore not necessarily the one with the most charts or the most sophisticated appearance. It is the one that allows the right person to see an important financial change quickly, understand what caused it, and decide what should happen next.
As a final visual reference, financial simulation dashboards can demonstrate how assumptions such as price, demand, variable cost, and fixed cost can be brought together to examine possible profitability outcomes. :contentReference[oaicite:11]{index=11}
:contentReference[oaicite:12]{index=12}
A well-built financial dashboard ultimately turns financial information into a practical management system: one that makes performance easier to understand, exceptions easier to investigate, and decisions easier to support.
