A strong marketing market size and potential Template should do more than display a large market number. It should show how the market is defined, where the underlying inputs came from, which customer segments are relevant, what portion can actually be served, and what share is realistically obtainable. In practice, the most useful template connects market research with assumptions, formulas, segmentation, scenario analysis, and a clear summary that decision-makers can understand quickly.
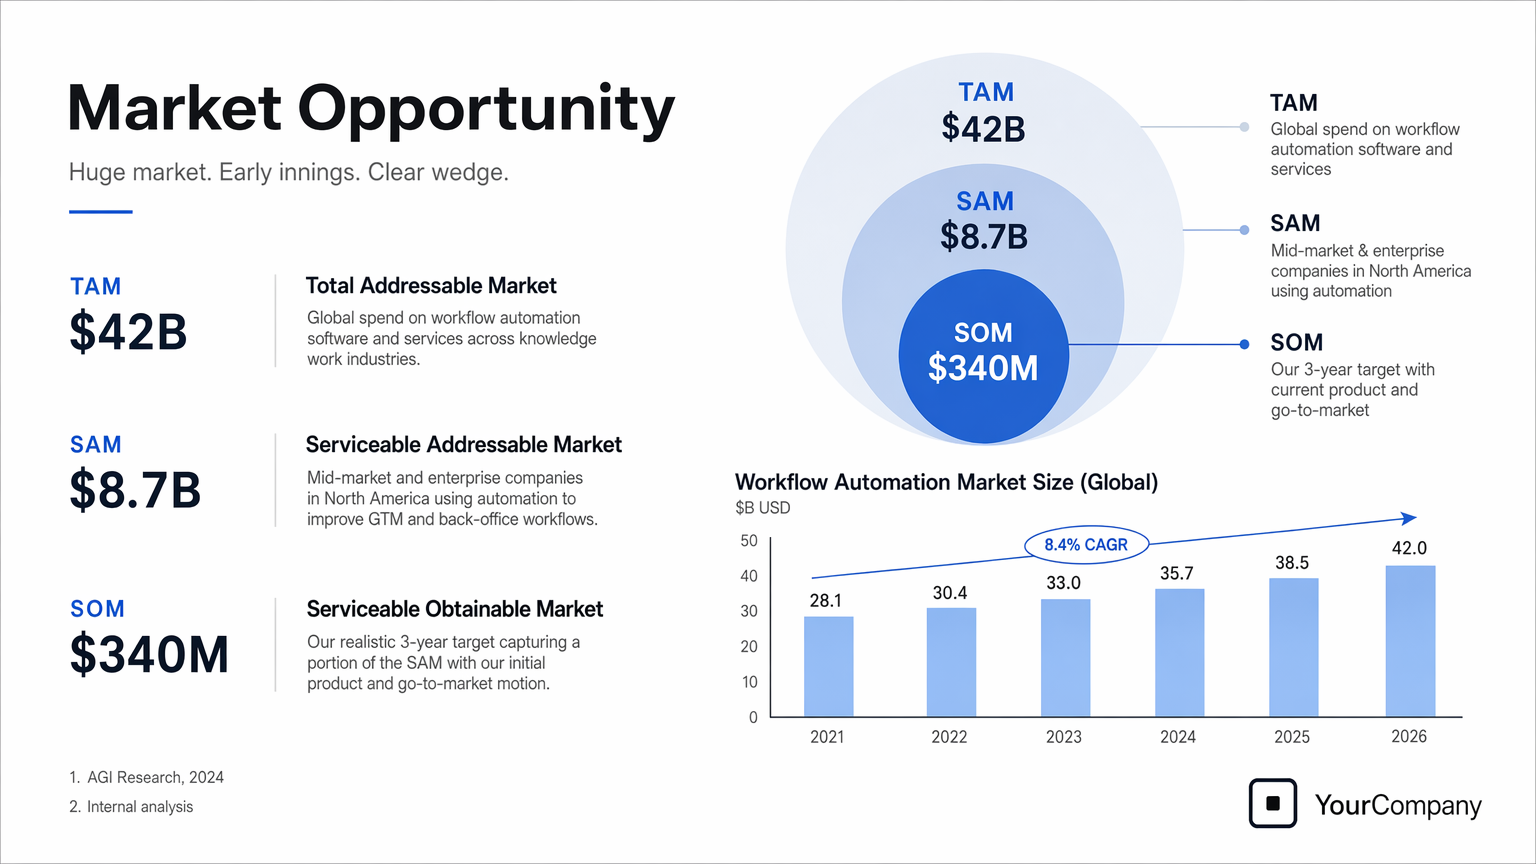
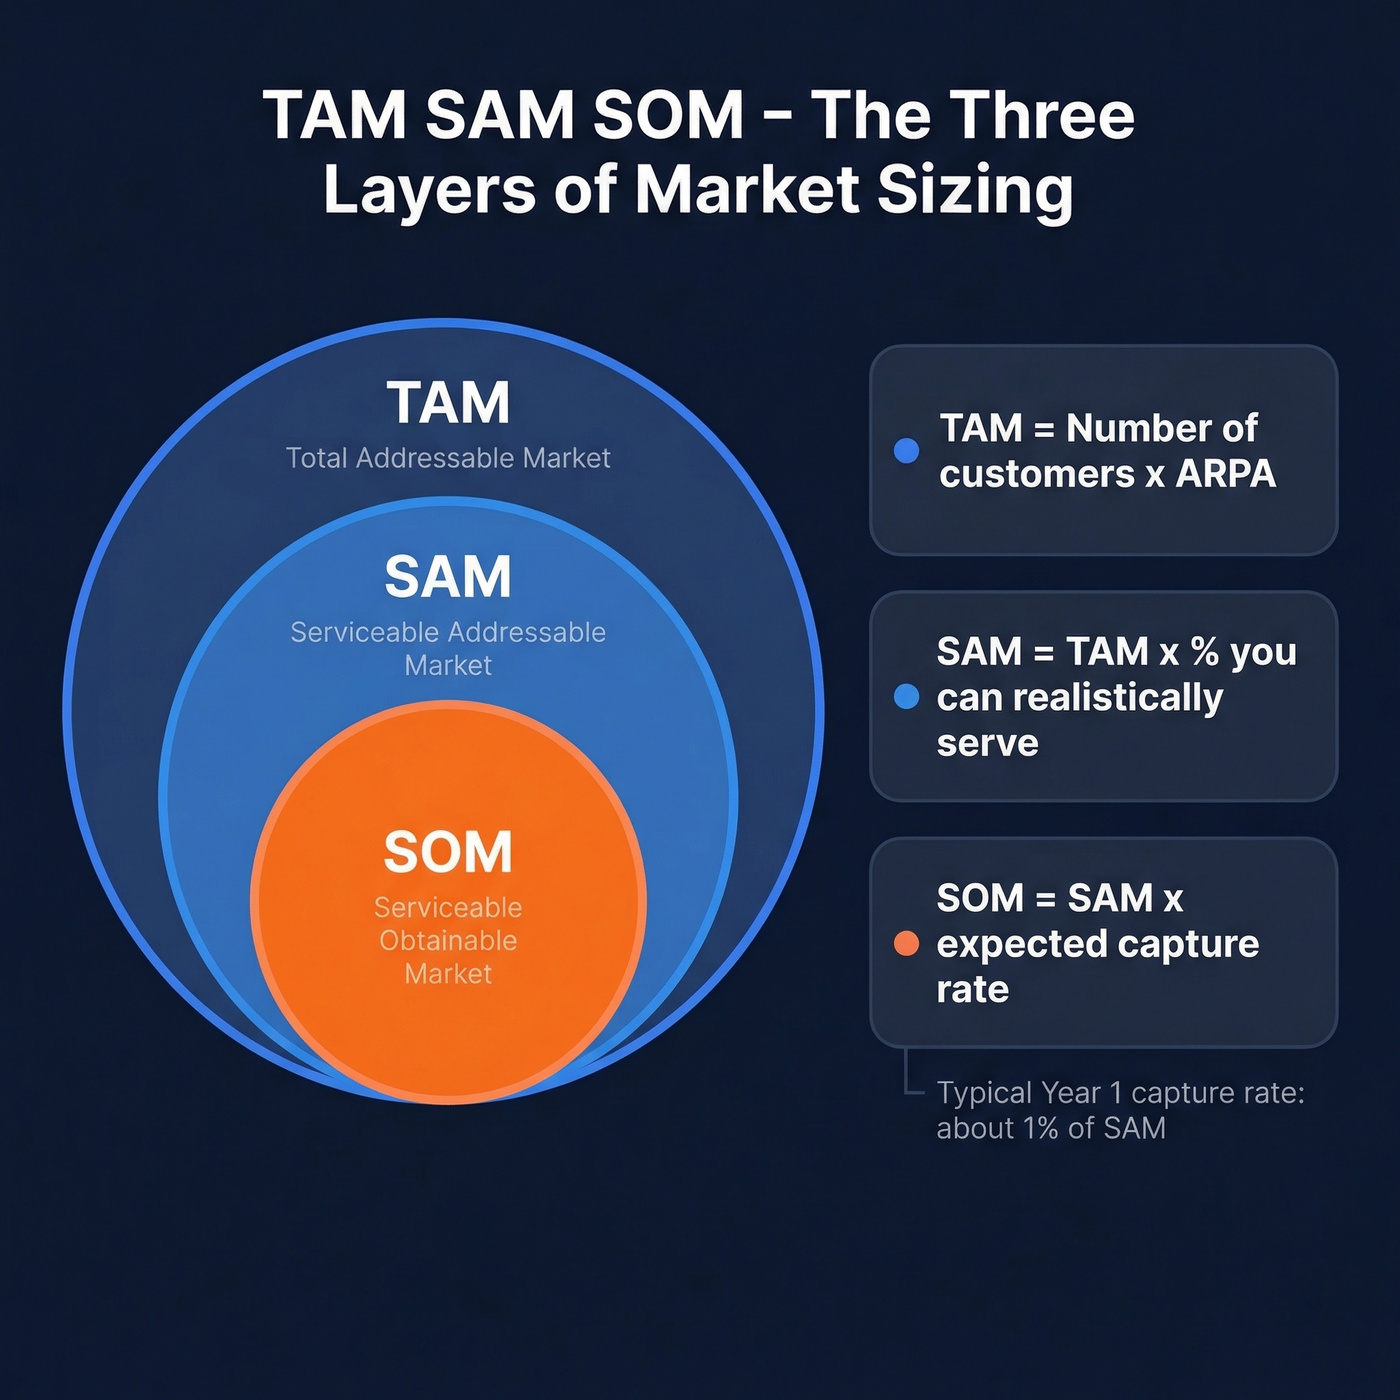
Market sizing is commonly organized around three nested measures: Total Addressable Market (TAM), Serviceable Addressable Market (SAM), and Serviceable Obtainable Market (SOM). TAM establishes the broad opportunity, SAM narrows it according to product, geography, customer, and channel constraints, and SOM represents a realistic capture target. Reliable market-sizing work uses these layers to connect strategic ambition with operational reality rather than treating TAM as a forecast of actual revenue. :contentReference[oaicite:0]{index=0}
The central value of a good template is consistency. Every assumption should have a defined unit, period, geography, source, and rationale. That makes the model easier to update when pricing changes, a new region becomes available, a customer segment is removed, or competitive conditions shift. A well-structured workbook can therefore become a working strategic model instead of a static presentation artifact.

What a Market Size and Potential Template Should Contain
The first layer should define the market itself. Write down the product or service, customer category, geographic scope, measurement period, revenue basis, and inclusion rules. For example, a B2B marketing platform might define its market as businesses with a particular employee range in selected countries that purchase digital marketing services annually. This boundary prevents unrelated spending from being counted simply because it belongs to a much larger industry.
The second layer should contain the quantitative inputs. Depending on the business model, these can include potential customer count, annual spending per customer, purchase frequency, average selling price, annual contract value, category adoption, serviceable percentage, obtainable share, and expected growth. A spreadsheet should keep inputs visibly separate from calculated outputs so a reviewer can tell which values are sourced facts and which are assumptions.
The third layer should explain the logic. A strong model makes it possible to trace an output backward to the assumptions that created it. If TAM is calculated from potential customers multiplied by annual revenue per customer, both inputs should be visible. If SAM is narrowed by geography and customer fit, those filters should be explicit rather than hidden inside one percentage. This transparency is particularly important when the model will support budgeting, investment analysis, product planning, or market-entry decisions.

TAM, SAM, and SOM: The Core Structure
TAM represents the broadest defined revenue opportunity. A common bottom-up formulation is potential customers multiplied by annual revenue per customer. For businesses with different customer tiers, it is usually better to calculate each tier separately and then aggregate them. This avoids mixing small accounts with enterprise accounts when their prices, buying cycles, and purchasing behavior are materially different. :contentReference[oaicite:1]{index=1}
SAM is the part of TAM that fits the actual offering and current route to market. Geographic coverage, product capabilities, pricing, industry specialization, language, regulation, distribution, and customer size can all influence the serviceable portion. A good template records each filter individually. Instead of writing “SAM equals 40% of TAM,” record why the 40% exists and what evidence supports it.
SOM goes one step further by asking what can realistically be captured. Competition, sales capacity, brand awareness, conversion rates, channel reach, marketing budget, customer acquisition economics, and implementation capacity can all limit obtainable share. A credible SOM should therefore connect with operating capacity rather than simply using an attractive percentage of SAM. Market-sizing guidance from Wall Street Prep and Seer similarly emphasizes narrowing the broad opportunity through customer and business constraints. :contentReference[oaicite:2]{index=2}

Why the Three Layers Matter
The three layers answer different management questions. TAM asks whether the category is large enough to matter. SAM asks where the business can realistically compete today. SOM asks what portion can plausibly be captured within a defined planning horizon. Keeping these questions separate prevents the common mistake of presenting a theoretical market ceiling as though it were a near-term revenue forecast.
The framework is also useful for prioritization. Two markets may have similar TAM values but dramatically different SAM and SOM profiles. One might be large but difficult to reach because of geography or regulation. Another might be smaller but have strong product fit, lower competitive intensity, and a much clearer route to customers. The second market can therefore be more attractive despite having the smaller headline number.
For marketing teams, this distinction helps connect market sizing to campaign planning. TAM can inform long-range category strategy, SAM can define the addressable audience for a campaign, and SOM can help establish realistic acquisition targets. This creates a bridge between strategic market research and measurable execution.

Top-Down and Bottom-Up Market Sizing
Top-down sizing begins with a broader industry figure and progressively filters it. The starting figure might come from an industry report, government dataset, trade association, financial disclosure, or another identifiable source. The analyst then removes categories that do not match the defined market. The advantage is speed and access to established market-level information, but the method can become misleading when broad categories contain spending that the business cannot actually serve.
Bottom-up sizing starts with the economics of the specific customer and offering. A basic structure is customer count multiplied by revenue per customer, followed by adjustments for adoption, frequency, eligibility, reach, or expected capture. The method takes more work because every input needs support, but it provides a direct connection between market size and the mechanics of the business. Wall Street Prep describes customer count and pricing as core drivers of a bottom-up market-size calculation. :contentReference[oaicite:3]{index=3}
The strongest models use both methods as a cross-check. If a top-down estimate produces a dramatically larger figure than a bottom-up model, investigate the difference instead of choosing whichever number looks better. The gap may indicate different market definitions, an overly broad industry category, an unrealistic customer count, an incorrect price assumption, or a missing segment. The reconciliation itself can reveal important strategic information.

How to Size a Market Step by Step
If you are asking how to size a market, start with the decision the analysis needs to support. A market model for a new product launch may require customer demand, competitive alternatives, pricing, and adoption assumptions. A model for geographic expansion may focus more heavily on regional customer counts, purchasing power, channel availability, and local competition. Defining the decision first keeps the research focused.
Next, establish the market boundary. Specify who counts as a customer, what they buy, where they are located, how often they purchase, and which products or services belong in the category. Record the measurement year and currency. If the market is measured in annual revenue, keep all downstream calculations on the same annual basis unless the model explicitly converts between periods.
Then collect the smallest defensible set of inputs. Separate sourced facts from assumptions. For example, a public business registry might provide a customer count, while your pricing assumption might come from competitor research and your own positioning. Do not disguise assumptions as facts. A transparent estimate with clearly labeled uncertainty is usually more useful than a precise-looking figure whose underlying logic cannot be inspected.

Step 1: Define the Customer Universe
Customer count is often the foundation of a bottom-up model. Define whether the unit is an individual, household, company, location, account, subscription, or another measurable entity. Avoid broad labels such as “small businesses” when the real target is narrower. A specific definition makes it easier to find appropriate evidence and prevents accidental double counting.
Segmentation should reflect meaningful differences in economics or buying behavior. For example, enterprise customers may have a much higher annual contract value than smaller customers. A consumer product may require geographic and demographic segmentation. A professional service may need separate estimates for industries with different demand levels. The template should allow these segments to be calculated independently.
After defining segments, check whether the totals reconcile. If five segments are supposed to represent the whole market, their combined population should have a logical relationship to the broader customer universe. Any overlap should be documented. This simple quality check can prevent major errors before they reach the final market-size figure.

Step 2: Establish Revenue Per Customer
The revenue-per-customer input depends on the business model. A subscription business might use annual recurring revenue per account. A transactional business may use average order value multiplied by expected purchase frequency. A service business might use average annual contract value or average annual spending. The important point is to match the revenue metric to the purchasing behavior being modeled.
Pricing should be treated as an assumption that can change. If a business has several plans, calculate each customer segment using the price that realistically matches that segment. Using the highest listed price for every customer can inflate the estimate, while using the lowest price can understate the opportunity.
A useful model can include conservative, base, and upside cases. Each case should change explicit assumptions rather than simply multiplying the final answer by an arbitrary factor. This makes sensitivity analysis more informative because management can see whether the market depends mainly on customer volume, pricing, adoption, or obtainable share.
Market Segmentation and Potential
Segmentation transforms a large market into groups that can be evaluated separately. Useful dimensions include geography, customer size, industry, use case, buying channel, product tier, and purchase frequency. The right segmentation is not the one with the most categories; it is the one that reveals differences in market economics or strategic fit.
For example, a hypothetical B2B marketing platform could segment its market into small companies, mid-market firms, and enterprises. Suppose the model estimates 20,000 small firms at an annual value of $1,000, 5,000 mid-market firms at $5,000, and 500 enterprise accounts at $25,000. The resulting segment values would be $20 million, $25 million, and $12.5 million respectively. These are illustrative figures, not market statistics, but they show why customer segmentation can materially change the analysis.
Segmentation also improves resource allocation. If one segment contributes a large portion of SAM but has low conversion potential, while another segment is smaller but easier to reach, the model can highlight the trade-off. This is where market size and market potential become strategically useful rather than merely descriptive.

Using a Template for Marketing Planning
A practical marketing market size and potential template excel structure should include an input sheet, calculation area, assumptions log, segment analysis, scenario controls, and summary dashboard. The spreadsheet should use consistent formulas so changes to customer count or pricing automatically flow through TAM, SAM, SOM, and forecast values.
A marketing market size and potential template google sheets structure can follow the same logic. The important distinction is not the spreadsheet platform but the model architecture. Keep assumptions visible, protect calculated fields from accidental changes, identify source dates, and use consistent units. Collaborative editing can be useful when marketing, finance, sales, and product teams need to challenge different assumptions.
For presentation work, a marketing market size and potential template ppt should be treated as the communication layer rather than the calculation engine. A good presentation usually shows the market definition, TAM, SAM, SOM, growth logic, principal assumptions, and the strategic implication. The underlying worksheet should contain the detailed evidence that supports the concise slide.

Choosing Document Formats for Market Analysis
A marketing market size and potential template google docs format is useful when the analysis needs more narrative context than calculations. It can organize market definitions, source notes, research observations, assumptions, and methodology. However, numerical calculations are generally easier to audit in a spreadsheet, so a document should complement rather than replace the calculation model.
A marketing market size and potential template pdf is useful when a finalized report needs a stable presentation format. It can preserve page structure, charts, explanatory notes, and executive summaries. The important distinction is between a working model and a finalized report: the former should remain easy to update, while the latter should communicate a defined version of the analysis clearly.
A marketing market size and potential template word structure can work well for a formal market-sizing report containing methodology, source notes, assumptions, interpretation, and recommendations. The same content can later support a board memo, business plan, strategy review, or research document. Regardless of format, the evidence chain should remain traceable.

Estimating Potential Market Size With Evidence
People searching for how to estimate potential market size often begin with a market report. That can be useful, but it should not be the only evidence. Start by defining the market, then identify the customer universe, spending level, purchase frequency, and service constraints. Use multiple independent sources where practical, especially for the assumptions that have the largest influence on the final result.
Source quality should be evaluated by relevance, recency, methodology, geography, and unit definition. A current global revenue estimate may be unsuitable if your business only serves a narrow regional segment. Likewise, a customer-count estimate may not be useful if it includes organizations that do not purchase the category.
The model should also show uncertainty. Rather than reporting a single number as though it were observed fact, create a range when important assumptions are uncertain. A base case can sit between conservative and upside scenarios. This makes the model more useful for planning because decision-makers can see which assumptions would need to change for the opportunity to become materially larger or smaller.

Target Market Size Example
A useful target market size example should demonstrate the calculation without pretending that hypothetical numbers are real research. Consider a fictional software provider targeting 12,000 businesses. Assume an illustrative annual revenue per customer of $2,000. The simple TAM would be $24 million. If only 50% fit the company’s geographic and product requirements, the illustrative SAM becomes $12 million.
Now suppose the business has limited sales capacity and believes it can realistically capture 5% of SAM during the planning period. The illustrative SOM would be $600,000. Again, these numbers are purely demonstrative. Their purpose is to show how the template moves from customer universe to revenue opportunity while making each assumption visible.
The example becomes more useful when sensitivity analysis is added. If the annual value per customer rises from $2,000 to $3,000 while the customer count remains unchanged, TAM rises proportionally. If the addressable customer percentage falls because a geographic market is removed, SAM declines. If sales capacity doubles, SOM may increase without changing TAM. This shows why each layer should be modeled independently.

Connecting Market Size to Growth Forecasts
Market size and market growth are related but should not be confused. A large market can grow slowly, while a smaller market can grow rapidly. Your template should therefore separate the current market value from the expected growth rate and show the period used for the forecast.
When forecasting, distinguish between market growth and company growth. If the category grows by a certain rate, that does not automatically mean the company will grow at the same rate. Company performance depends on customer acquisition, retention, pricing, competition, distribution, capacity, and market share. A market-growth assumption belongs to the market model; a company-growth assumption belongs to the operating forecast.
For scenario planning, create separate assumptions for category growth, customer expansion, pricing, serviceable reach, and obtainable share. This allows the model to answer practical questions such as whether growth is primarily driven by market expansion or by gaining share. It also makes strategic priorities easier to identify.

Using Market Size for Strategic Decisions
Market sizing becomes much more valuable when it changes a decision. A company may use the model to compare two countries, select a customer segment, determine whether a new product deserves investment, evaluate channel opportunities, or establish a realistic revenue target. The model should therefore end with decision-relevant interpretation rather than stopping at a number.
For example, suppose Segment A has a $100 million SAM but requires a specialized sales force, while Segment B has a $70 million SAM and can be reached through an existing channel. Segment B could have the stronger near-term opportunity despite the smaller serviceable market. The template can make that trade-off visible by combining market size with reach, conversion, competition, and capacity assumptions.
Market sizing can also support resource allocation. If a particular segment accounts for most of the realistic opportunity, marketing investment can be concentrated there. If another segment has high theoretical potential but weak serviceability, product or distribution changes may be needed before additional marketing spending makes sense.

Common Market-Sizing Mistakes
The first common mistake is using an oversized industry number that does not match the actual product category. A broad market statistic can look impressive while including customers, products, or geographies that the company cannot serve. The solution is to define the market boundary before selecting the headline number.
The second mistake is treating market share as an arbitrary percentage. Saying that a company will capture 1% or 5% of a large market does not explain why that share is achievable. A stronger SOM model connects capture with customer reach, sales capacity, conversion, competitive intensity, and the time period being analyzed.
The third mistake is hiding assumptions. If the model depends on an estimated customer count, pricing assumption, adoption rate, or growth rate, label it. The goal is not to eliminate uncertainty; it is to make uncertainty visible enough that another person can challenge, improve, or replace an assumption without rebuilding the entire model.

Email and Document Design Considerations
The phrase email template size for marketing describes a different but related design problem: the dimensions and content structure of an email communication. It should not be confused with market sizing. In a broader marketing workflow, however, both can appear in the same planning system. Market sizing determines whom the campaign is intended to reach and the scale of the opportunity, while communication templates determine how that audience is addressed.
Keep analytical documents visually consistent. Use the same terminology for TAM, SAM, and SOM across worksheets, reports, slides, and internal planning documents. If a figure is labeled “serviceable market” in one place and “reachable market” somewhere else, define the relationship clearly so stakeholders do not interpret them as separate metrics.
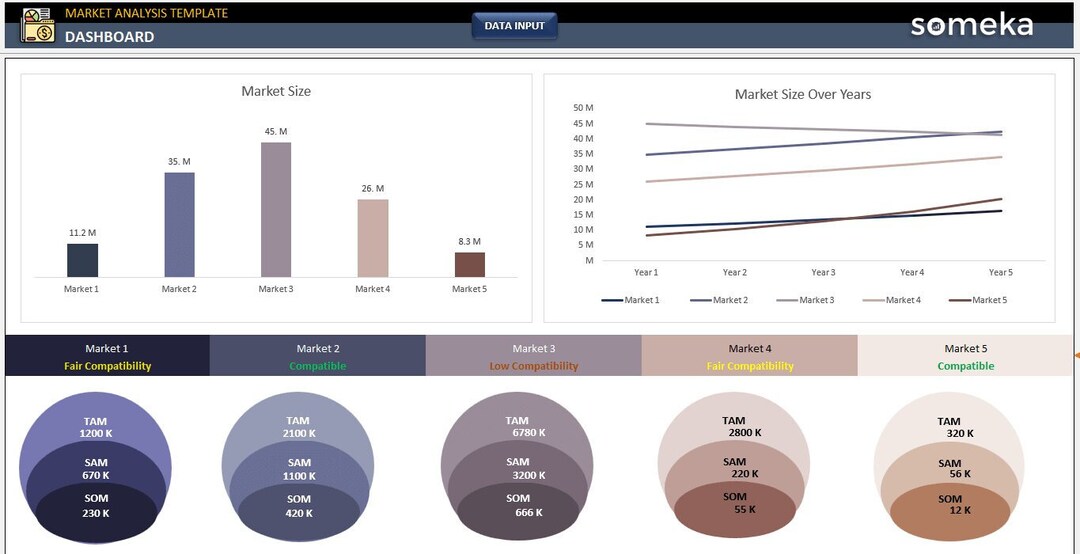
Charts should also reinforce the model rather than decorate it. A funnel can show progressive filtering, concentric circles can show nested market layers, and a line chart can show projected market development. A segment bar chart can compare opportunities, while a sensitivity chart can reveal which assumptions have the greatest effect on the final estimate.
Practical Solution
The practical solution is to build one central market-sizing model with five clearly separated areas: market definition, evidence, assumptions, calculations, and decision output. Start by writing the market boundary in plain language. Then create a source register containing the source name, date, geography, metric, and relevance. Keep assumptions in their own area so reviewers can distinguish evidence from interpretation.
Next, build the bottom-up calculation. Enter customer counts by segment, revenue per customer, purchase frequency where relevant, and any adoption or eligibility filters. Calculate TAM first, then apply explicit serviceability filters to reach SAM. Build SOM from realistic reach and capture constraints. In parallel, create a top-down estimate where credible market-level data exists. Reconcile the two methods before using the result in a strategy document.
Finally, create three scenarios and identify the assumptions that matter most. Change one major input at a time to see how strongly the output responds. If a small pricing change causes a large shift in SOM, pricing deserves management attention. If geography has the greatest effect on SAM, expansion research may be more valuable. If sales capacity limits SOM, the issue is operational rather than market size. This turns the template into a decision system rather than a collection of numbers.
A useful final review should ask whether every number has a unit, period, geography, source or stated assumption, and logical relationship to the next calculation. It should also ask whether the model describes a market that the business can genuinely serve. If the answer is unclear, revise the definition before refining the arithmetic. Directional accuracy and transparent assumptions are generally more valuable than artificial precision.
Building a Reusable Market-Sizing Workflow
A reusable workflow begins with research and ends with a decision. The research stage defines the category and gathers evidence. The modeling stage converts that evidence into a structured estimate. The validation stage compares different methods and challenges assumptions. The reporting stage turns the result into a concise narrative for stakeholders.
Keep version dates visible. Markets change, prices change, competitors enter and exit, and customer definitions evolve. A model created several years ago may still be useful as a historical reference, but it should not silently become the basis for a current decision. A review cycle should be triggered whenever a major pricing, geographic, product, channel, or customer-segment assumption changes.
For teams working together, assign ownership to the assumptions rather than only to the final spreadsheet. Marketing may own audience and campaign reach assumptions, finance may review revenue logic, sales may validate obtainable capacity, and product teams may validate serviceability. This creates a stronger internal challenge process and reduces the risk that one optimistic assumption determines the entire market narrative.
Reference Examples
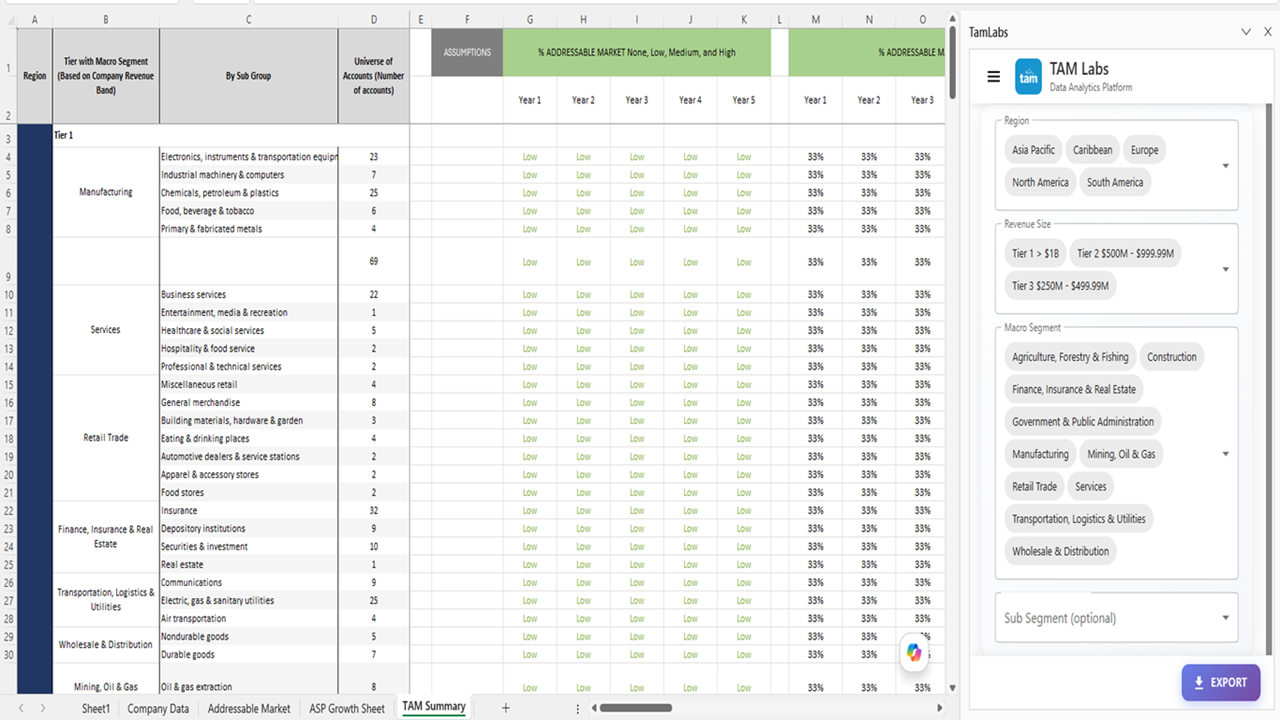
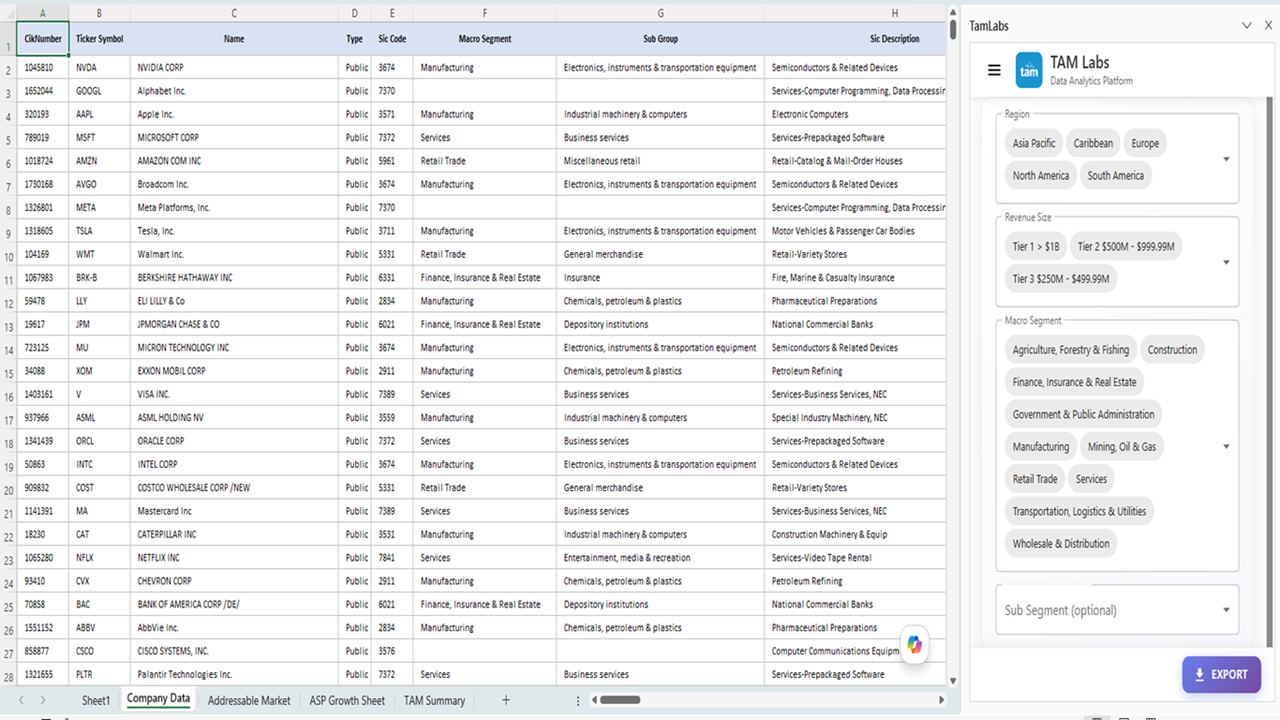
The following visual references show how a marketing market size and potential Template can be represented through spreadsheets, nested market diagrams, calculation frameworks, and presentation layouts. Each example emphasizes a different part of the same central idea: defining a broad opportunity, filtering it according to serviceability, and translating the remaining market into a realistic obtainable target. When reviewing any reference, pay attention to the relationship between the visual structure and the assumptions behind it rather than copying its figures.
These references are most useful when evaluating the structure of your own model. Spreadsheet examples can help with input organization and calculation flow, while diagrams can help communicate TAM, SAM, and SOM to stakeholders. A strong template should combine both qualities: detailed enough to audit, but clear enough to explain. The figures shown in the references may represent specific examples from their original sources and should not automatically be treated as estimates for another industry, company, geography, or planning period.
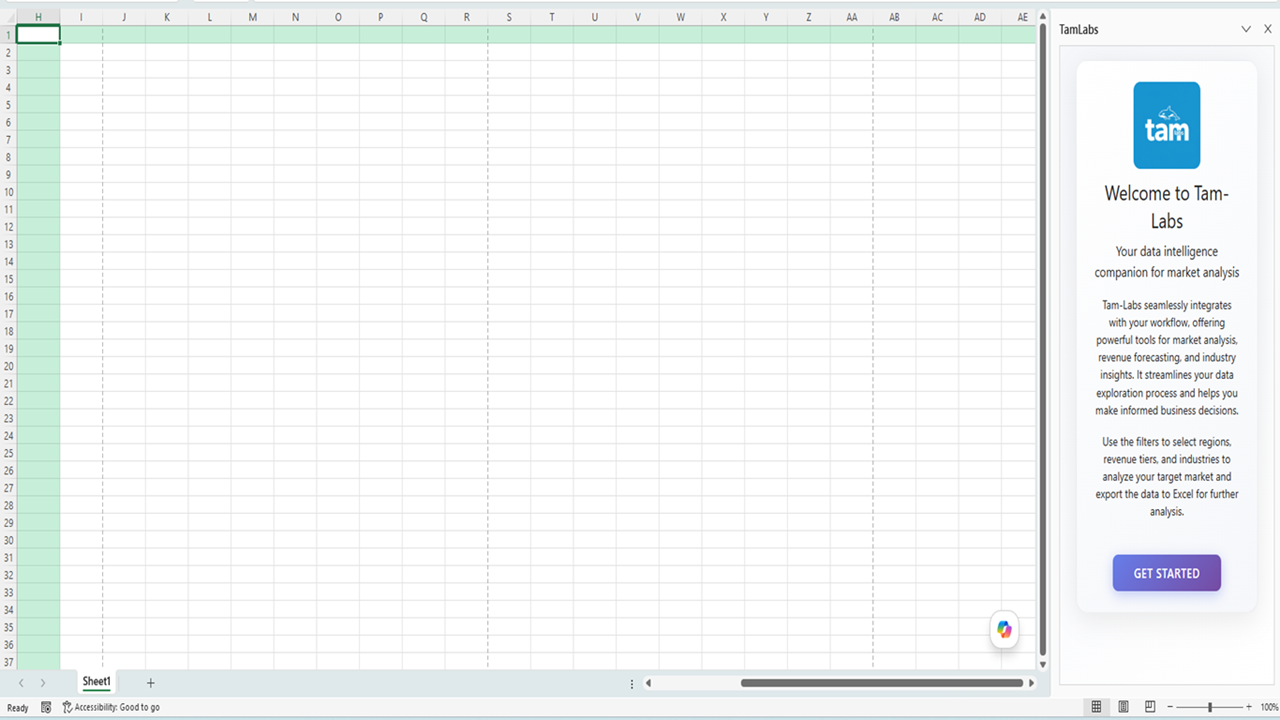
TAMLabs market sizing screenshot
Source: Microsoft Marketplace
TAMLabs market analysis screenshot
Source: Microsoft Marketplace
TAMLabs market sizing analysis
Source: Microsoft Marketplace
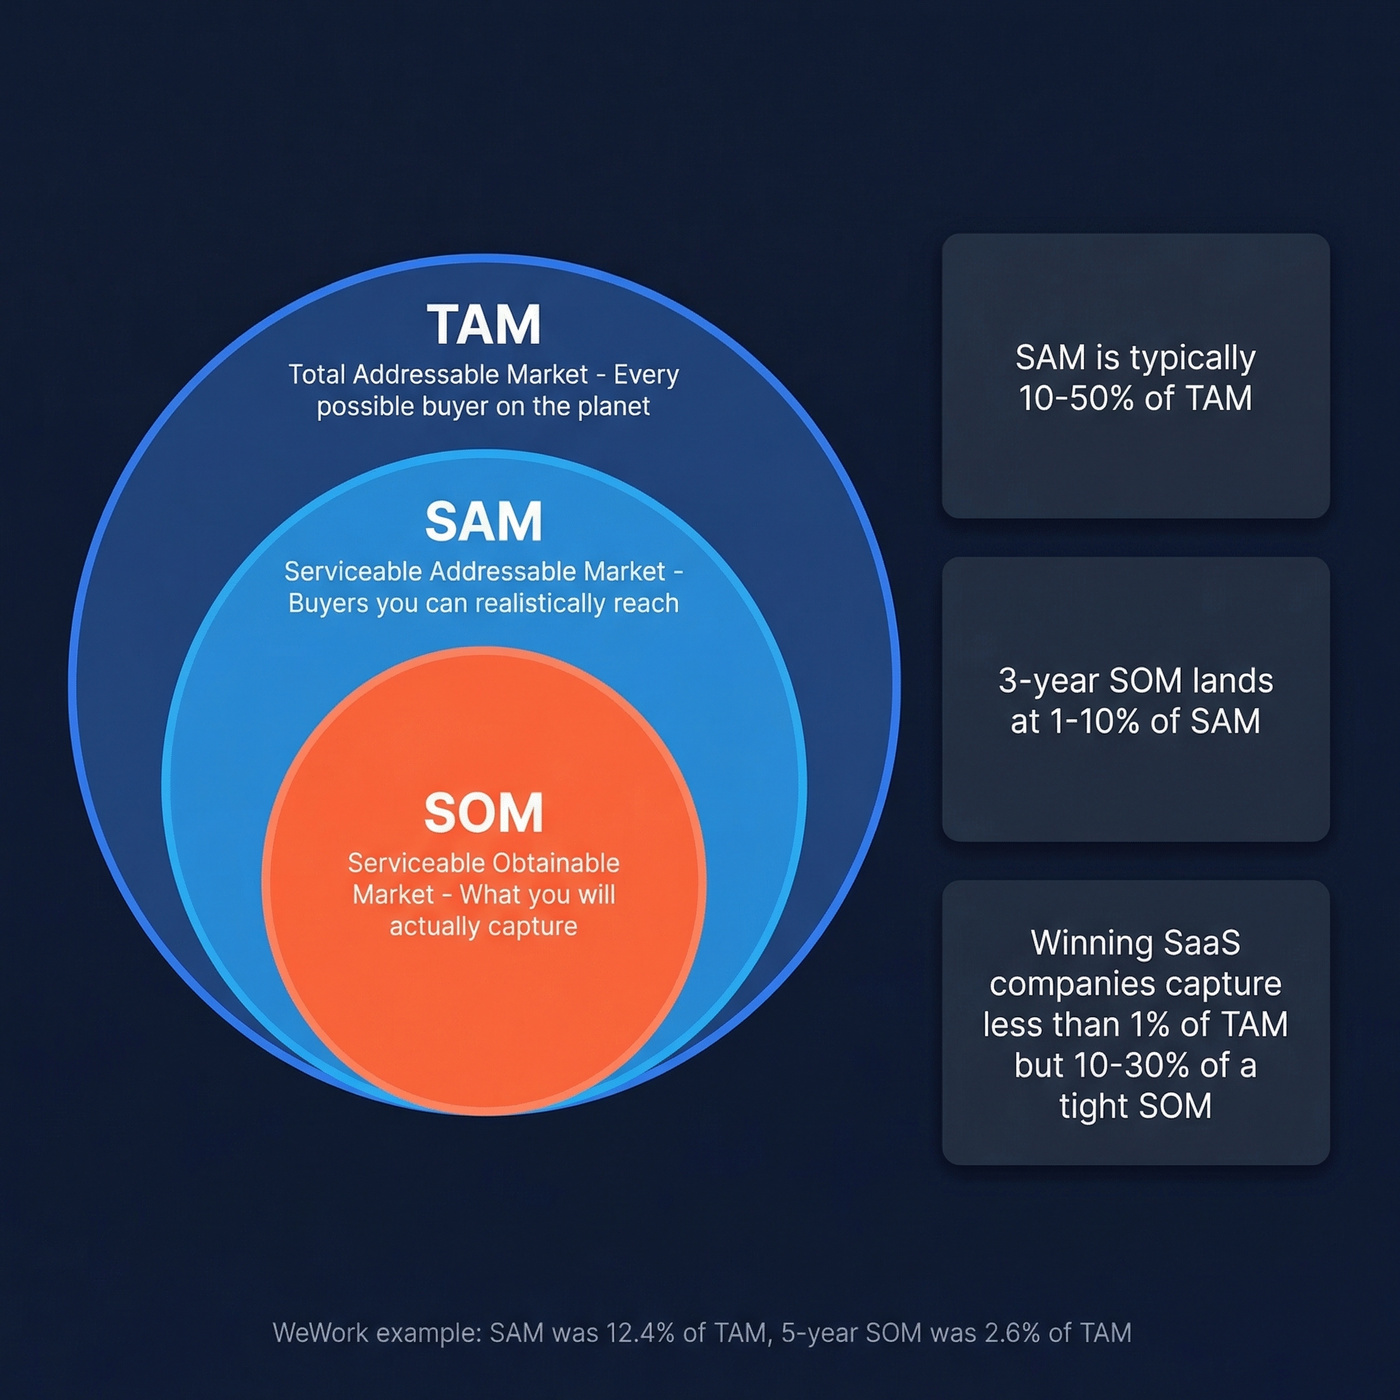
TAM, SAM, SOM Concentric Circles Diagram
Source: Prospeo
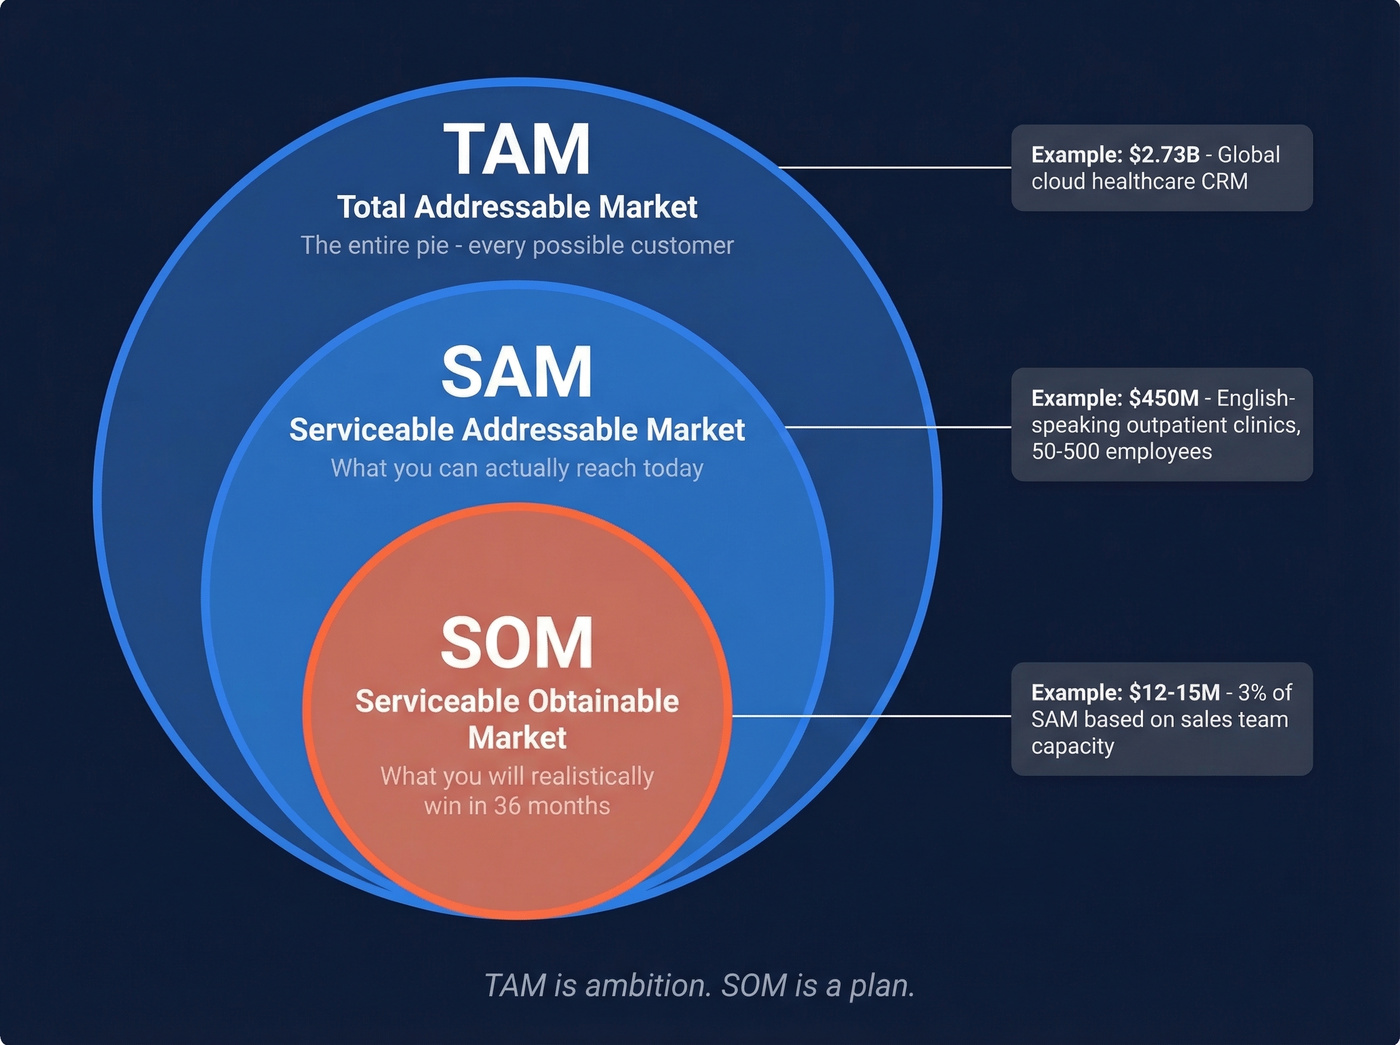
TAM vs SAM vs SOM Nested Circles Diagram
Source: Prospeo

TAM, SAM, and SOM Market Sizing
Source: Creatio
Determine Your Market Size

Source: LinkedIn
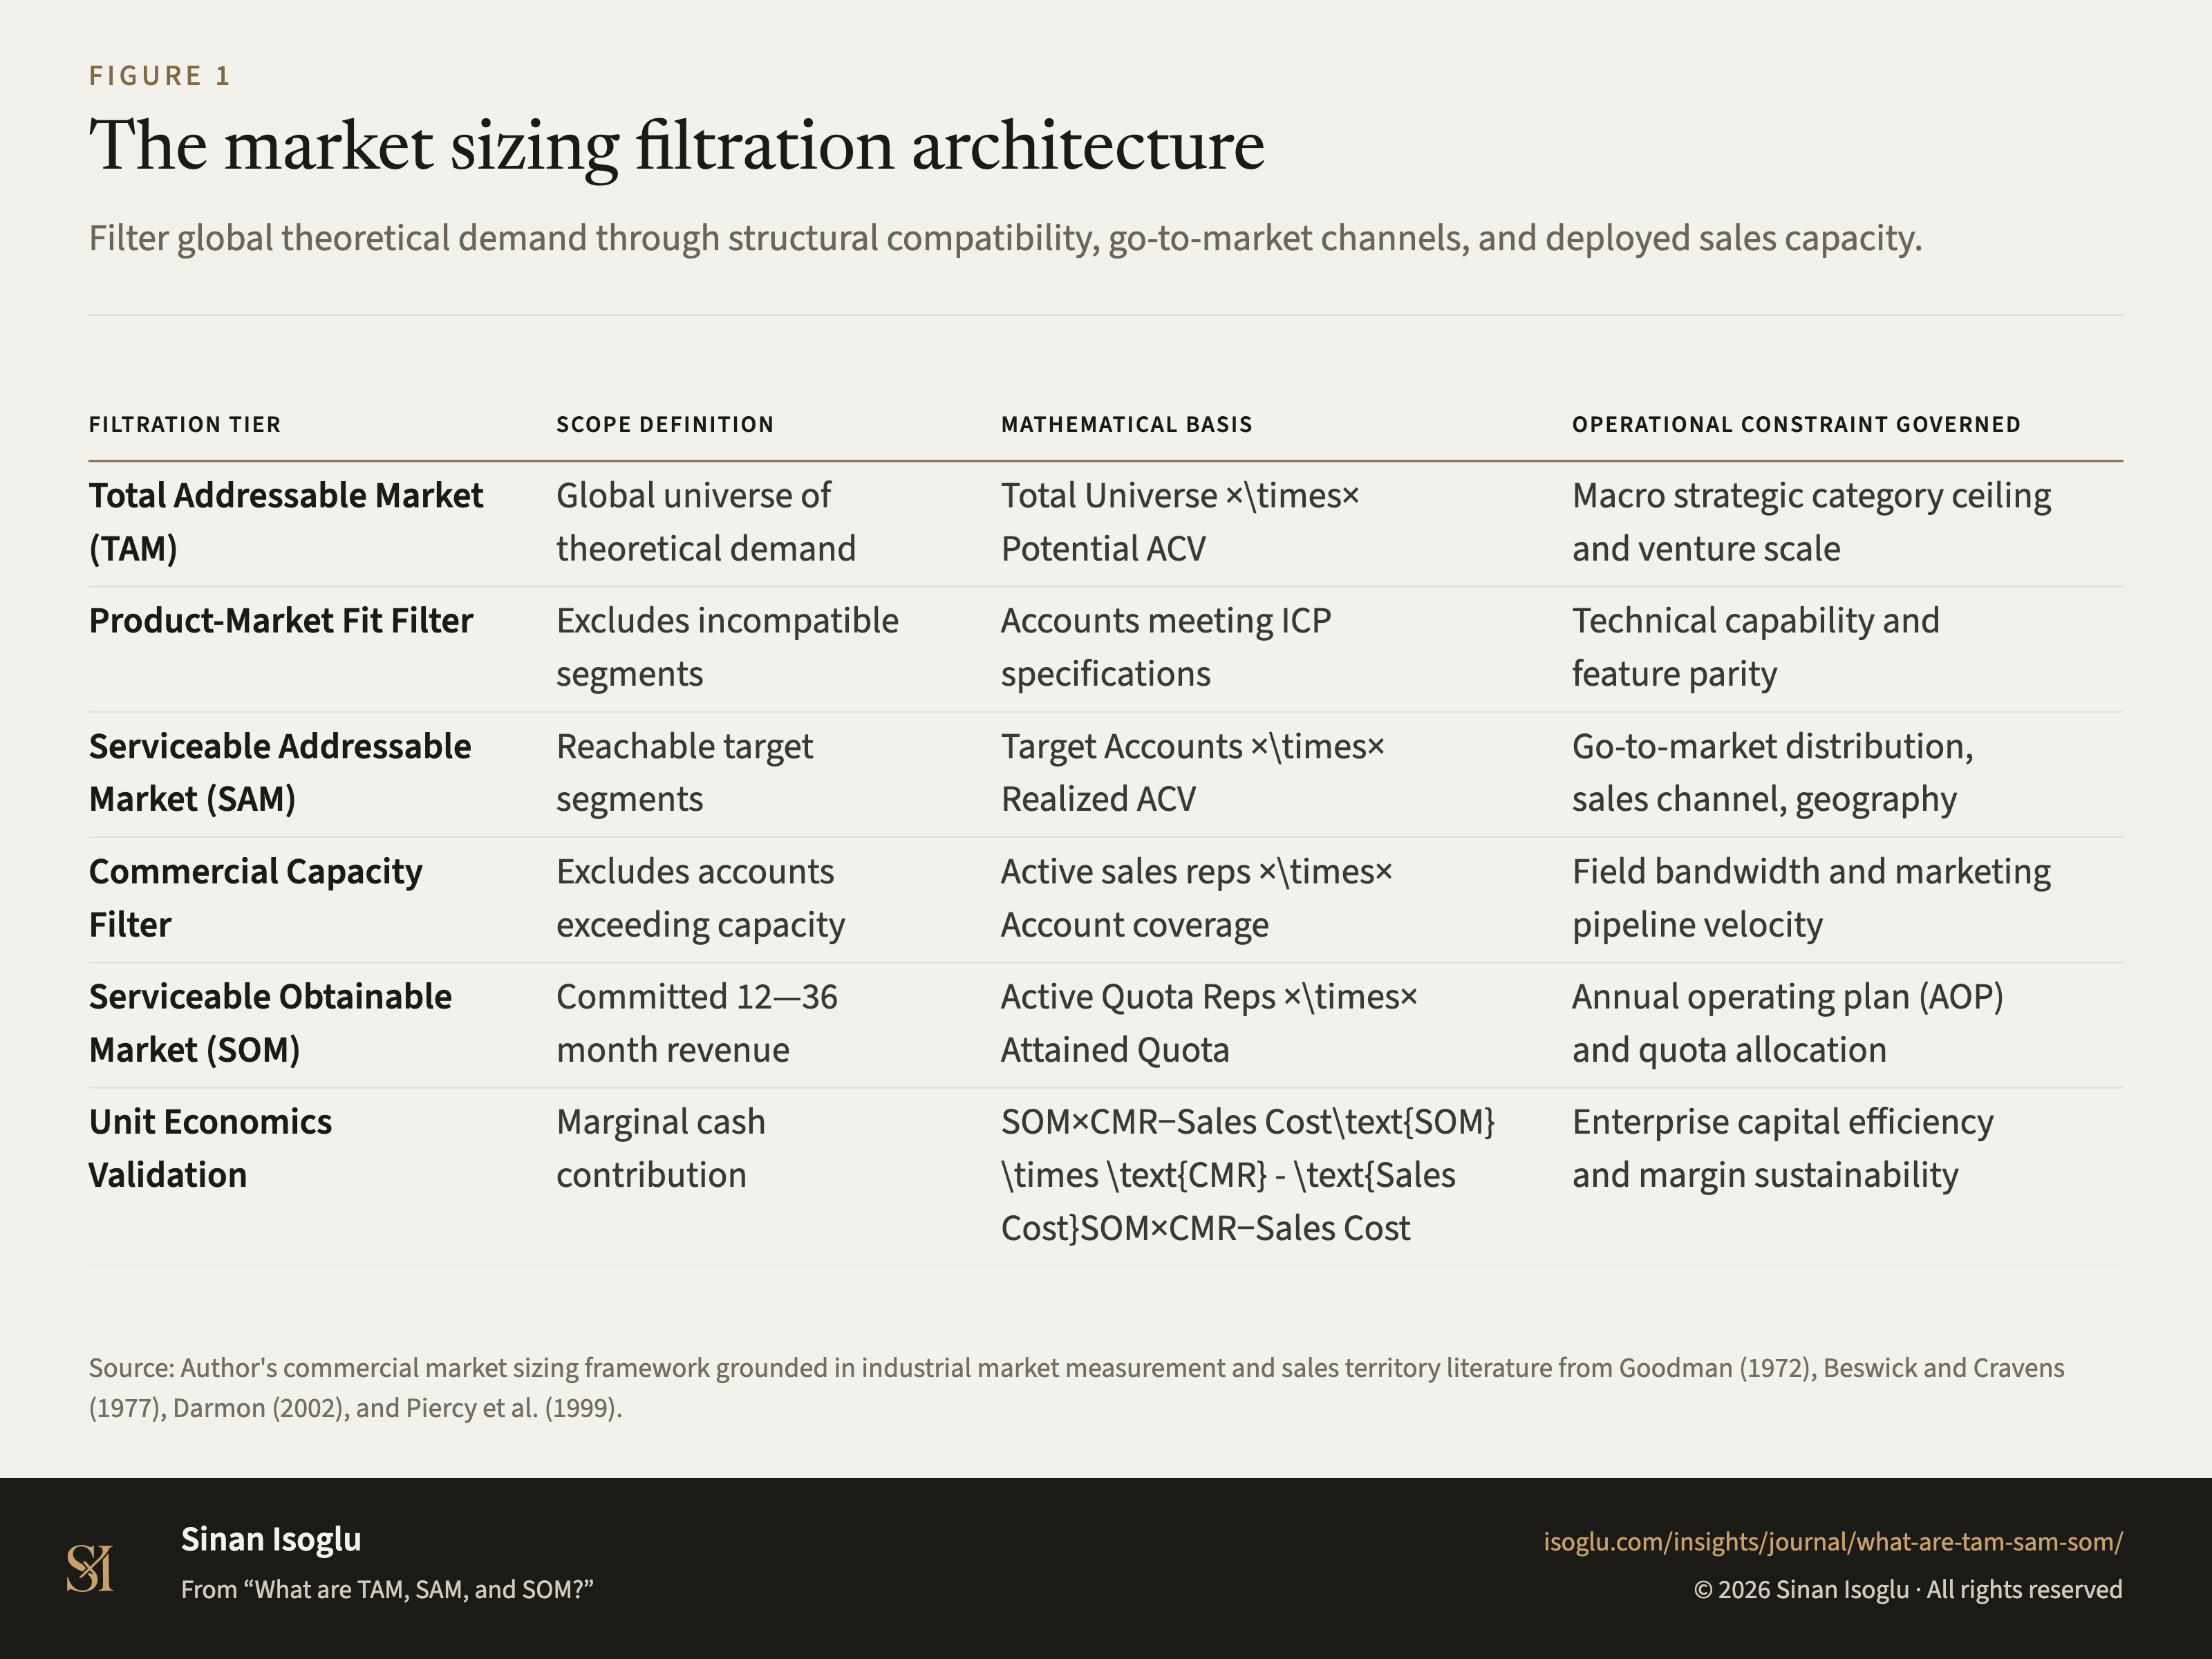
The market sizing filtration architecture
Source: Isoglu
