A pitch deck business financial plan Template is more than a collection of attractive slides or a condensed spreadsheet. It is a structured way to translate a company’s business model into revenue expectations, costs, margins, cash needs, milestones, and a funding request that another person can understand quickly. Investors generally want financial information that connects directly to the operating story: how the company earns money, what drives growth, what consumes cash, and what milestones the proposed capital should help achieve. Current guidance from investor-pitch resources consistently emphasizes clarity, defensible assumptions, and consistency between the financial model and the presentation.
The strongest template therefore works as a bridge between a detailed financial model and an investor-facing presentation. The underlying model can contain monthly calculations, assumptions, scenarios, and supporting schedules, while the deck should summarize the most decision-relevant information. This distinction matters because a business plan pitch deck is designed to communicate an investment case efficiently rather than reproduce every worksheet. A useful template gives founders a repeatable framework for revenue projections, gross profit, operating expenses, cash flow, unit economics, funding requirements, and use of funds without making the audience decode a wall of numbers.
What a Pitch Deck Business Financial Plan Template Is Designed to Do
The purpose of a financial plan inside a pitch deck is to show how the company’s strategy translates into economics. A reader should be able to see the relationship between customers, pricing, revenue, direct costs, operating expenses, cash consumption, and future profitability. The financial section also provides a numerical test of the broader business narrative. If the deck says customer acquisition will accelerate, the forecast should contain a corresponding sales or customer-growth mechanism. If the company expects margins to improve, the model should explain what changes operationally to produce that improvement.
A good template also separates historical performance from forecast assumptions. Established companies can show actual revenue, gross margin, operating profit, cash balances, and other meaningful indicators before presenting forward estimates. Earlier-stage companies may have limited historical data, so the emphasis shifts toward operating drivers and milestones. In either case, the presentation should make it obvious which figures are known and which are estimates. That transparency makes the forecast easier to challenge, revise, and defend.
The financial section should not attempt to replace the entire financial model. A practical structure is to maintain a detailed model separately and use the pitch deck to present its most important outputs. Investor-facing guidance commonly recommends showing revenue, expenses, profitability measures, cash requirements, and assumptions while keeping detailed calculations outside the presentation. This approach produces a deck that remains readable while giving the founder enough underlying analysis to answer follow-up questions.

Core Components of the Financial Plan
Revenue model and operating drivers
Revenue should begin with the mechanism that creates sales rather than with an arbitrary growth percentage. A subscription company might model the number of paying accounts, average revenue per account, expansion, and churn. A marketplace might use transaction volume, take rate, and repeat usage. A physical-product company may use units sold, average selling price, channel mix, and returns. These drivers make the forecast understandable because every major revenue figure can be traced to an operating assumption.
For example, imagine a hypothetical subscription business beginning with 500 paying customers at an average monthly revenue of $40. The first forecast should not simply state that annual revenue will grow by 80%. Instead, it could model new customers added each month, customer losses, price changes, and the resulting average customer base. If the company later reaches a higher revenue level, the investor can see which operational levers produced it. The numbers are illustrative rather than a forecast for any particular company.
This driver-based approach also helps identify unrealistic assumptions. If revenue rises dramatically while customer additions, pricing, conversion, and retention remain unchanged, the model has an internal inconsistency. A template should therefore make key drivers visible enough that the founder can inspect the logic before converting the numbers into a polished slide.
Costs, gross profit, and operating expenses
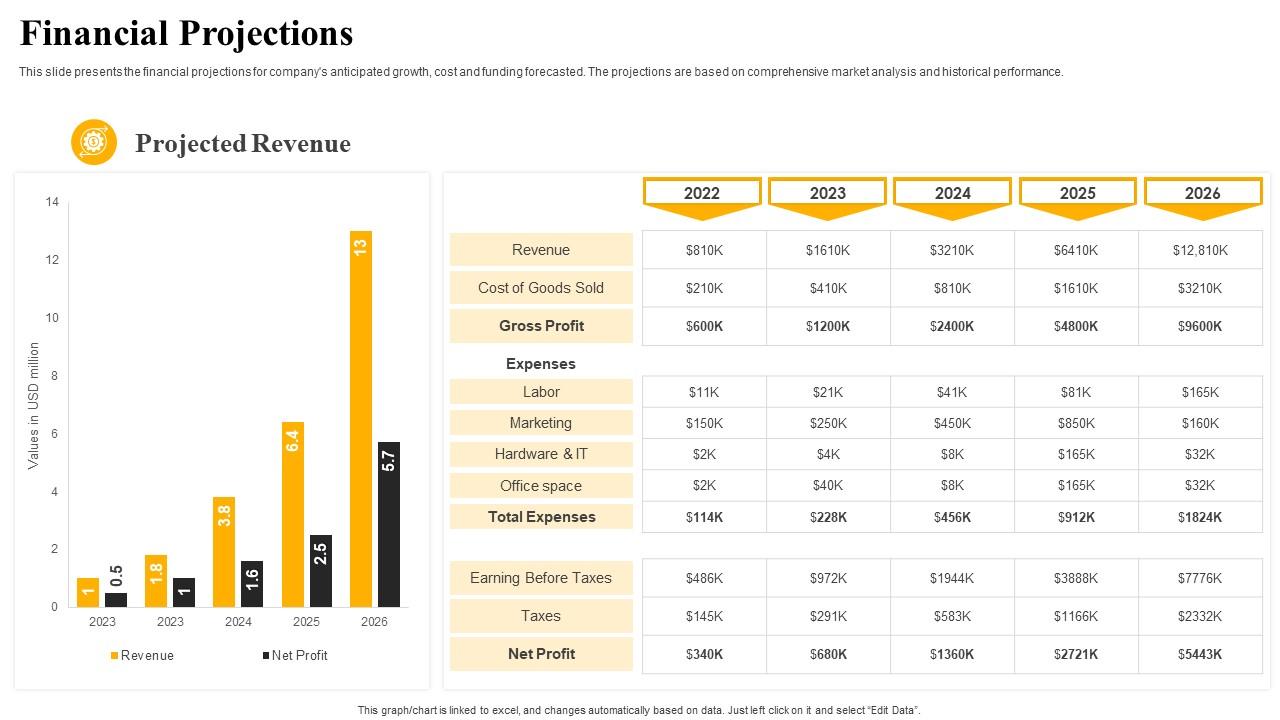
Revenue alone does not demonstrate a viable business. The next layer is cost structure. Direct costs associated with producing or delivering the offering should be separated from operating expenses such as sales, marketing, research, administration, and other overhead. This separation allows the deck to show gross profit and gross margin before the broader operating-cost structure is considered.
Gross margin is particularly useful because it reveals how much revenue remains after direct delivery costs. Two companies with identical revenue can have very different economics if one requires substantially more direct expenditure to serve each customer. A financial plan should therefore explain whether margin improvement comes from pricing, procurement, automation, scale, product mix, or another operating change rather than assuming that margin will rise automatically.
Operating expenses should also be linked to milestones. Hiring, marketing expenditure, infrastructure, research, and geographic expansion should have a reason for appearing in the forecast. A funding request becomes more credible when expenses are connected to measurable progress, such as launching a product, increasing capacity, entering a market, or reaching a specific level of recurring revenue.

Cash flow, burn rate, and runway
Profit and cash are not interchangeable. A company can show accounting profit while still experiencing periods of significant cash pressure because customers pay later, inventory must be purchased in advance, equipment requires capital expenditure, or debt and financing obligations affect cash movement. For a pitch deck, the cash view helps explain how long the proposed capital can support operations and what milestones are achievable before additional financing may be required.
Burn rate is the pace at which cash is consumed during a period, while runway describes how long available cash can support the business under the modeled spending pattern. These concepts are especially important for early-stage companies. A template should make it possible to identify periods where cash becomes tight rather than focusing exclusively on a visually attractive upward revenue curve.
Cash-flow planning can also expose timing problems hidden by annual figures. A company might appear adequately funded when viewed annually but encounter a cash deficit in a particular month because hiring, inventory, or capital expenditure occurs before expected customer receipts. Detailed monthly modeling is therefore useful even when the pitch deck itself presents only a simplified annual or quarterly view.
How to Structure the Investor-Facing Financial Slides
A concise financial section usually works best when it answers a sequence of investor questions. First, what has already happened? Second, how does the business make money? Third, what does management expect to happen over the next several years? Fourth, what assumptions drive the forecast? Fifth, how much capital is required and what will it accomplish? The precise number of slides can vary by company and stage, but the logic should remain easy to follow.
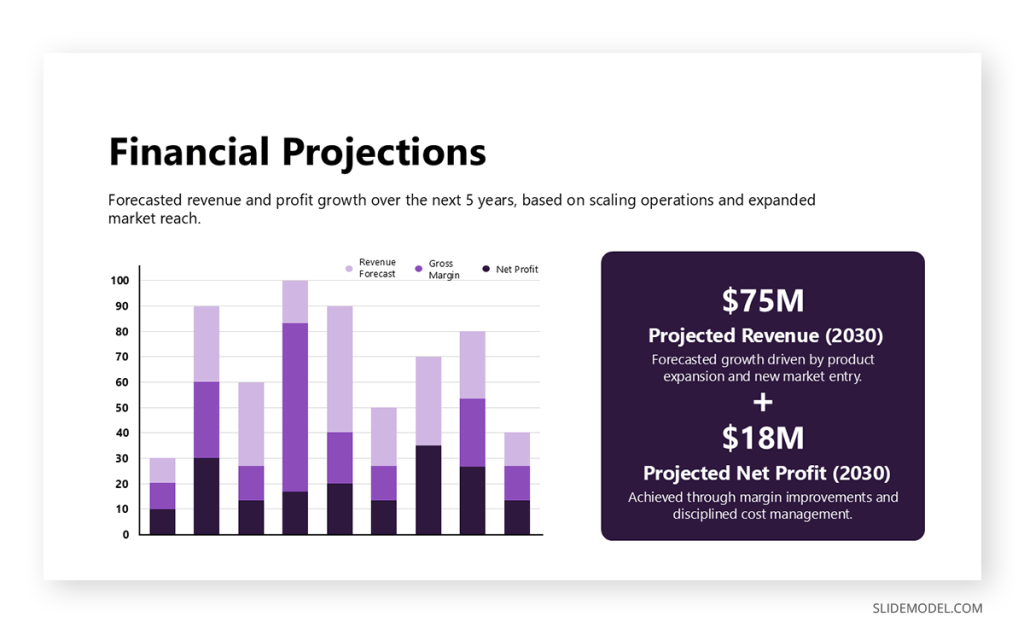
The first financial slide can emphasize traction and the most important historical indicators. A second can present forward projections. A third can explain use of funds or the relationship between funding and milestones. Unit economics may deserve its own slide when customer acquisition and retention are central to the model. Current fundraising guidance often separates traction, projections, and use of funds so each slide has a clear job.
The presentation should avoid turning every financial statement into a full spreadsheet screenshot. Investors need enough detail to understand the economics, but excessive detail reduces readability. A useful design pattern is one primary chart, a small number of supporting metrics, and a short explanation of the assumptions. The underlying model remains available for deeper review when questions arise.

Choosing Excel, PDF, Google Docs, PowerPoint, or PPT Formats
Different formats serve different purposes. A pitch deck business financial plan template excel structure is useful when the financial plan needs formulas, linked assumptions, scenario calculations, and changing forecasts. Spreadsheet-based modeling is particularly valuable for testing how revenue, hiring, pricing, costs, or financing decisions affect the business. The presentation should generally be generated from the model’s outputs rather than manually re-entering numbers in multiple places.
A pitch deck business financial plan template pdf is better viewed as a presentation or distribution format rather than the ideal place to build a dynamic model. PDF preserves the appearance of the finished document and is useful when the recipient needs a consistent visual version. However, changing assumptions inside a PDF is not the same as changing the underlying financial model. For that reason, a founder should retain an editable source model even when the investor-facing document is distributed as a PDF.
A pitch deck business financial plan template free can be a useful starting point when the goal is to understand structure before investing time in custom design. Likewise, a pitch deck business financial plan template free download may appear attractive in search results, but the important question is whether the underlying structure is suitable for the company’s actual business model. Template quality should be judged by logic, clarity, editability, assumptions, and consistency rather than by price alone.
For collaborative editing, a pitch deck business financial plan template google docs workflow may be useful for narrative sections, planning notes, and shared review, although a spreadsheet is generally more appropriate for complex financial calculations. A pitch deck business financial plan template powerpoint is well suited to the visual presentation itself because charts, labels, layouts, and investor-facing messaging can be arranged as slides. The related phrase pitch deck business financial plan template ppt reflects the same presentation-oriented use case.
For spreadsheet-oriented searches, founders may also encounter pitch deck business financial plan template excel free. The key evaluation criterion remains the same: does the structure support the company’s revenue model, cost behavior, cash flow, and funding logic? A simple template that is transparent and easy to audit can be more useful than a sophisticated-looking model filled with assumptions the founder cannot explain.

How to Build the Model Behind the Pitch Deck
Start by defining the forecast period and the operating units that actually drive the company. These might include customers, subscriptions, transactions, units, locations, employees, or contracts. Next, establish pricing and volume assumptions. Then calculate revenue from those drivers before adding direct costs. This sequence is important because it prevents the forecast from becoming a collection of independent numbers that do not relate to the operating model.
After revenue and direct costs are established, build the operating expense schedule. Separate recurring expenses from one-time investments where appropriate. Hiring should be modeled by role, timing, and compensation assumptions rather than as one unexplained annual figure. Marketing can be connected to acquisition targets or campaigns when appropriate. Capital expenditures should be separated from ordinary operating expenses so the cash implications are visible.
Finally, connect the income statement logic to cash flow. Include opening cash, operating cash movement, investing activity, financing activity, and ending cash when relevant to the company’s structure. Then test the model using alternative scenarios. The goal is not to predict every possible future but to understand which assumptions matter most and how changes affect funding requirements.

Using Unit Economics to Strengthen the Financial Story
Unit economics can make a pitch deck substantially more informative when the company has repeatable customer-level economics. Depending on the business, useful metrics can include customer acquisition cost, average revenue per customer, gross profit per customer, retention, payback period, or lifetime value. The correct metrics depend on the operating model, so a template should not force every company into the same formula.
The important principle is consistency. If the forecast assumes rapid customer growth, the unit-economics section should help explain how that growth can be financed and sustained. If acquisition becomes more expensive as the company scales, the model should reflect that possibility. If retention improves, the reason should be tied to an operational change rather than inserted solely to make lifetime value look stronger.
A financial investor template for pitch deck should therefore function as a decision framework rather than a collection of decorative metrics. Every displayed number should answer a business question. If a metric does not influence revenue, cost, cash generation, growth, risk, or funding decisions, it may not deserve valuable slide space.

Assumptions Investors Can Actually Challenge
Strong financial projections make assumptions visible. Typical assumptions include pricing, customer growth, churn, conversion, sales productivity, gross margin, hiring dates, compensation, marketing expenditure, infrastructure costs, and payment timing. The exact list should reflect the company. A business selling physical goods may need detailed inventory and working-capital assumptions, while a subscription business may focus more heavily on recurring revenue and retention.
Each major assumption should have a reason. Historical performance is useful when available, while customer research, signed contracts, pipeline data, pricing tests, supplier quotes, and operational capacity can provide support for forward-looking estimates. If there is insufficient evidence, the assumption should be clearly treated as a planning estimate rather than presented as an established fact.
Scenario analysis can make the model more useful without overwhelming the deck. A base case can represent the central operating plan, while downside and upside cases can reveal how sensitive cash needs and milestones are to major variables. The presentation does not need to display every scenario, but the founder should understand them before presenting the forecast.
Design Principles for Financial Slides
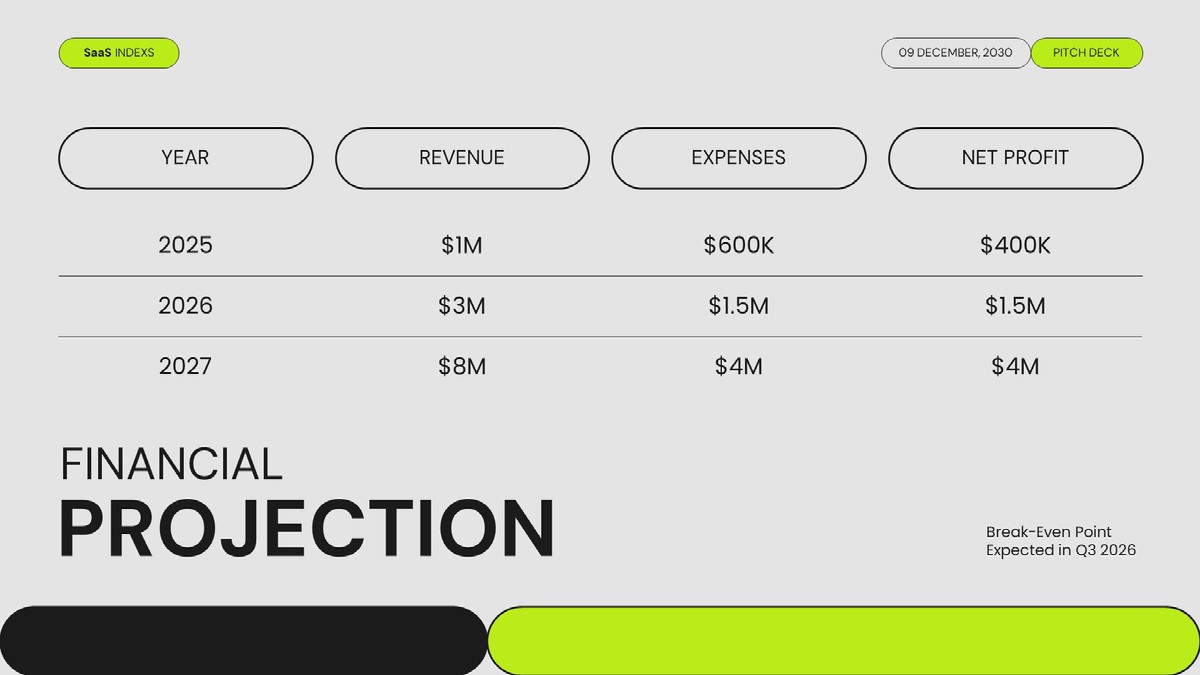
Good pitch deck design templates for business should make numbers easier to understand rather than simply make them look impressive. Use a clear visual hierarchy so the primary metric is immediately visible. Charts should have readable labels, consistent units, and a limited number of series. If a chart requires a long explanation before the audience understands it, simplify it.
Color should have a functional role. Revenue, expenses, cash, and profitability can each have consistent visual treatment across the deck. Avoid changing the meaning of colors from slide to slide. Similarly, keep the forecast period consistent unless a deliberate change is necessary. Visual consistency helps the investor focus on the business rather than reconstructing the presentation’s design system.
A company pitch deck template should also preserve room for context. A chart without a sentence explaining the main insight forces the audience to interpret the graph alone. A concise annotation can state that gross margin improves because of a specific operational change, that cash reaches a low point before a financing milestone, or that revenue growth is driven by a particular customer segment.

Common Mistakes That Weaken a Financial Pitch
One common mistake is building a top-down forecast that starts with a large market size and assigns the company an arbitrary share. Market size can provide context, but it does not explain how the company will generate actual sales. A stronger model begins with controllable operating drivers such as customers, transactions, pricing, capacity, and conversion.
Another mistake is presenting a dramatic growth curve without explaining the cost and operational requirements behind it. Rapid growth generally requires resources. Sales teams may need to expand, marketing expenditure may rise, customer support may become more complex, and infrastructure may require additional investment. A credible financial plan connects growth to the resources required to produce it.
A third mistake is inconsistency between slides. Revenue shown on the financial projection slide should match revenue in the model, and the funding request should reconcile with the use-of-funds breakdown. Even small discrepancies can create unnecessary questions. Maintaining one controlled source of financial truth is therefore an important professional practice.
Practical Solution
Begin with a detailed spreadsheet model and build the pitch deck from its outputs. First, document the revenue drivers and create a monthly or quarterly forecast appropriate to the company’s stage. Second, add direct costs and operating expenses so gross profit, operating profit, and cash movement can be calculated. Third, identify the three to five assumptions that have the greatest effect on the outcome. These assumptions should receive particular attention because they are likely to shape investor questions.
Next, convert the model into a small set of investor-facing slides. A useful sequence is historical traction, revenue model, financial projection, unit economics when relevant, cash and runway, and use of funds. Each slide should answer one important question. Avoid placing every financial statement on screen merely because it exists in the model. The deck is a communication layer; the detailed model is the analytical layer.
Before presenting, perform a reconciliation audit. Check that revenue, gross profit, operating expenses, cash requirements, funding amount, and major milestones agree across the deck and underlying model. Then test a downside case and ask whether the company still understands what actions would be required. Finally, rehearse the explanation of every major assumption. The best template is not the one with the most sophisticated formulas; it is the one that lets management explain the economics clearly and confidently.
Reference Examples
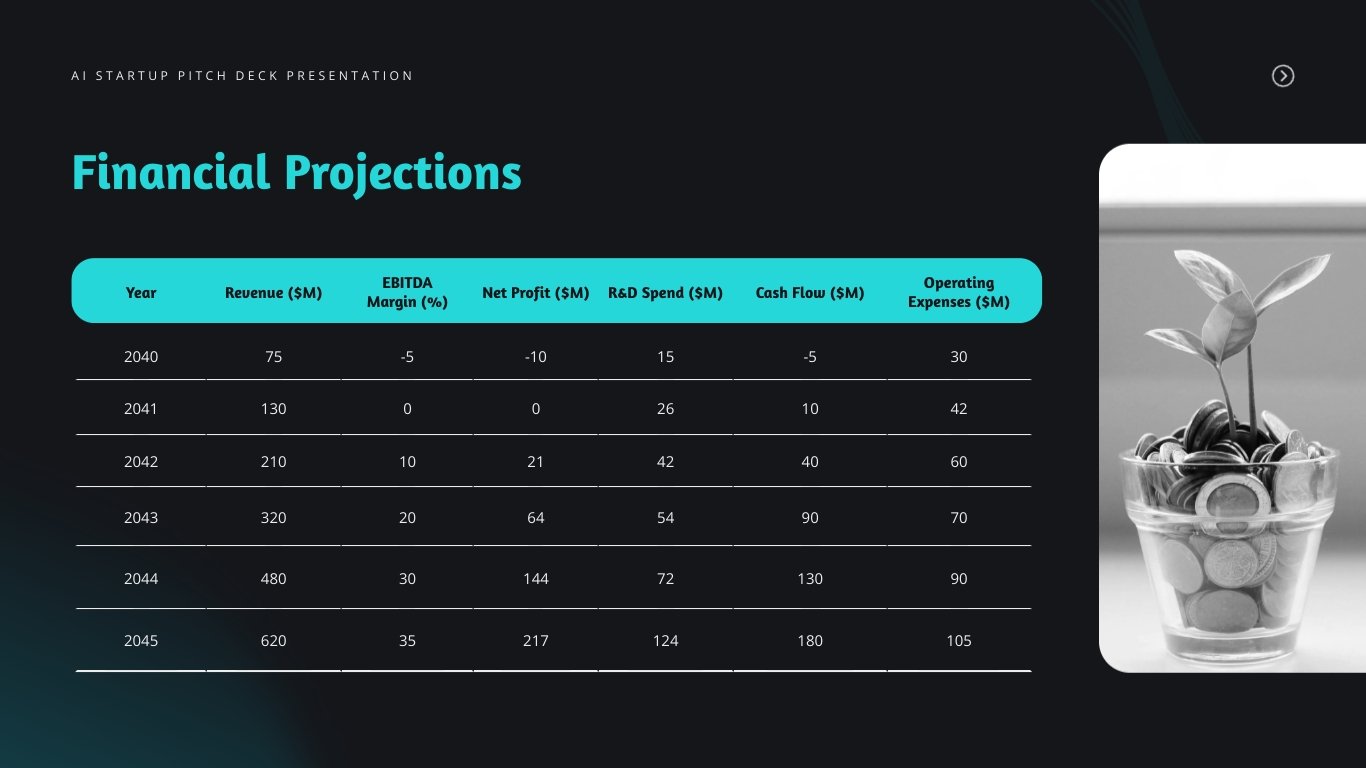
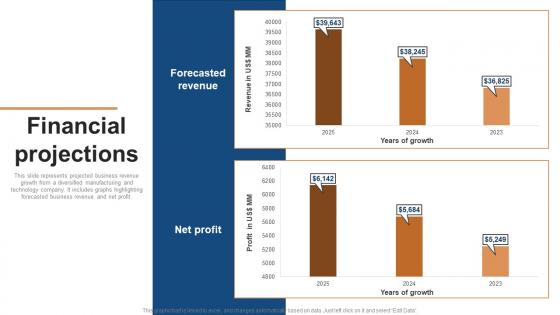
A pitch deck business financial plan Template is easiest to evaluate when readers can see how financial information is transformed into presentation-ready structures. Useful examples typically combine a forecast period with revenue, costs, profitability, cash flow, or operating drivers rather than presenting isolated numbers. The strongest visual references show a clear relationship between the business model and the financial outcome. They also demonstrate different ways to organize the same fundamental information: a projection table, a revenue chart, a cash-flow schedule, a profit-and-loss statement, or a compact investor dashboard. These examples should be treated as visual references, not as universal formulas for every company.
The following examples illustrate several ways a pitch deck business financial plan Template can be structured. A spreadsheet-style model is useful for tracing assumptions and calculations, while presentation-oriented charts can communicate the resulting story more quickly. A revenue comparison can help explain historical versus projected performance; a cash-flow view can highlight funding requirements; and a profit-and-loss layout can clarify the path from sales to profitability. Comparing these formats helps founders choose a structure that matches their business model, funding stage, audience, and level of available financial evidence.

Startup Financial Projection Slide
Source: SlideMembers

Use of Raised Funds
Source: SlideTeam

Financial Projection
Source: SlideGeeks

Financial Projections
Source: SlideGeeks
Financial Projections
Source: SlideGeeks

Simple Financial Model
Source: Wikimedia Commons

Business Plan
Source: Wikimedia Commons

Revenue Chart
Source: Wikimedia Commons

Comparative Analysis of Firm Revenues, Expenses, and Net Income
Source: Wikimedia Commons
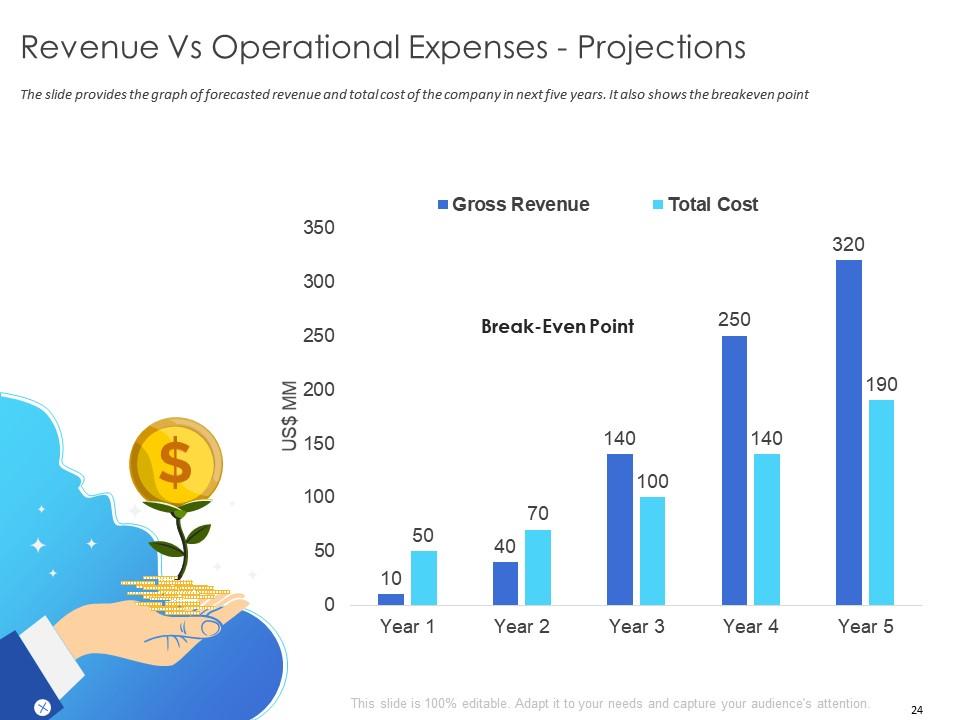
Five-Year Revenue vs. Operational Expenses Projections
Source: SlideTeam
