For finance managers, business owners, analysts, accountants, FP&A teams, and executives, the best template begins with the questions the dashboard must answer. Typical questions include whether revenue is on target, whether expenses are exceeding budget, whether margins are improving, whether cash is sufficient, and which business areas are driving changes. Microsoft describes KPI dashboards as tools that bring together data and provide visual feedback on key performance indicators, while its dashboard guidance emphasizes clarity, audience needs, prioritization, and appropriate visualizations.
The format matters too. Excel can be useful when users need familiar formulas, PivotTables, PivotCharts, slicers, and editable calculations. Google Sheets can be practical for collaborative browser-based work. Power BI is better suited to interactive reporting and connected data models. PowerPoint can turn selected dashboard views into executive presentation slides, while Word and PDF are useful when a financial dashboard needs to become part of a formal report or board pack.
This guide explains how to design, evaluate, customize, and use a financial dashboard template across those environments. It also covers the metrics that deserve priority, visual hierarchy, data preparation, variance analysis, cash-flow monitoring, reporting workflows, common mistakes, and a practical implementation method for creating a dashboard that remains useful after the initial design stage.
The examples throughout this article use hypothetical business situations unless a source is specifically identified. The purpose is not to prescribe one universal dashboard. Instead, the objective is to show how a professional design financial dashboard template can be structured so that its visual appearance supports accurate interpretation and practical financial decisions.
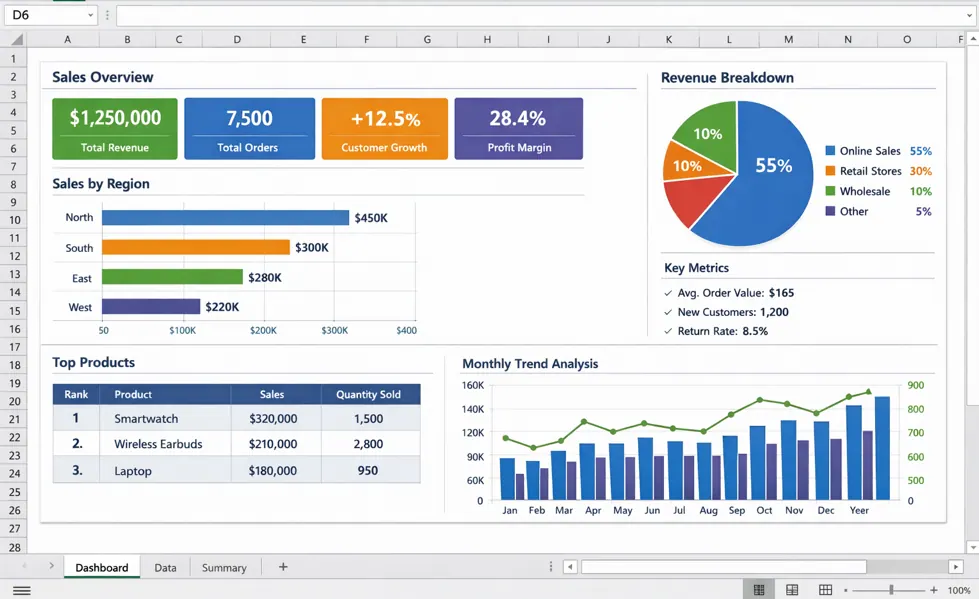
What Is a Professional Financial Dashboard Template?
A financial dashboard template is a reusable reporting framework that organizes important financial information into a visual layout. It normally contains predefined areas for headline KPIs, trend charts, comparisons, financial ratios, tables, and explanatory notes. Instead of beginning with an empty workbook or blank presentation, the user starts with a structure that can be populated with the organization’s own data.
The word professional should refer to more than visual polish. A professional template should have clear metric definitions, consistent units, logical grouping, readable labels, sensible calculations, and a hierarchy that guides attention. A dashboard with attractive colors but unclear formulas can create more confusion than a simple spreadsheet. Design quality therefore includes both visual communication and analytical reliability.
A strong template also separates source data from presentation. Raw transactions may contain thousands of rows, while the dashboard might contain only a dozen headline measures. Keeping these layers distinct makes the workbook easier to audit and reduces the temptation to overwrite calculations while editing the visual page.
Dashboard design should also reflect the intended audience. A CFO may want a concise view of revenue, margin, cash, forecast accuracy, and major variances. A finance analyst may need more detailed dimensions such as department, product, region, customer, or account. An operational manager may care more about budget consumption and cost drivers than capital structure.
Microsoft’s Power BI guidance similarly recommends considering the audience, keeping the most important information prominent, avoiding unnecessary clutter, and choosing visualizations that match the analytical task. These principles apply whether the final dashboard lives in Excel, Google Sheets, Power BI, or another reporting environment.
Why Financial Dashboards Matter
Traditional financial reporting is often periodic and document-heavy. A monthly management pack may contain an income statement, balance sheet, cash-flow statement, variance report, departmental schedules, and supporting notes. Those documents remain important, but a dashboard can provide a faster first view of the financial story.
The main advantage is concentration. Instead of asking a reader to search several reports for the same answer, a dashboard can put the relevant indicators together. Revenue can sit beside gross margin, cash balance, operating expenses, and budget variance. A trend chart can then show whether the current number is part of a temporary fluctuation or a longer movement.
Another advantage is consistency. If the same definition of revenue, gross profit, operating expense, or budget variance is used across monthly reports, managers can compare periods without continually reconciling different formulas. A template can document these definitions and establish a standard reporting structure.
Dashboards are also useful for exception management. A manager rarely needs every transaction displayed on the first screen. Instead, the dashboard can identify an unusual expense category, a deteriorating margin, a significant budget variance, or an aging receivables problem. The user can then investigate the underlying detail separately.
This distinction between overview and detail is important. A dashboard should not attempt to become the entire accounting system. Its role is to make the most decision-relevant information visible and provide a path toward deeper analysis when something deserves attention.

Core Components of a Professional Design Financial Dashboard Template
1. Executive KPI cards
KPI cards provide the first layer of information. Typical cards might show revenue, gross profit, net profit, operating cash flow, cash balance, EBITDA, margin percentage, or budget variance. Each card should have a clear label, reporting period, unit, and comparison where appropriate.
A number without context can be misleading. A revenue figure of $2 million might look impressive until the reader discovers that the budget was $2.5 million. Likewise, a profit figure may require comparison with the prior period or target before its significance becomes clear.
Useful comparisons include actual versus budget, current period versus prior period, year-to-date versus plan, and current year versus prior year. The right comparison depends on the decision being supported. A seasonal business, for example, may benefit more from year-over-year comparisons than a simple month-over-month percentage.
KPI cards should also avoid excessive precision. Displaying many decimal places can make an executive dashboard harder to scan without adding useful information. The detailed figure can remain available in the underlying report or data table.
Where a target exists, show it explicitly. A KPI becomes much more meaningful when the user can immediately see the current value, target, variance, and direction. Microsoft notes that KPI visuals are intended to evaluate a current value against a defined target or goal, which is a useful principle when deciding which metrics deserve KPI treatment.
2. Revenue and profitability trends
Revenue trends show the direction of the top line over time. A line chart is often suitable when the main question concerns movement across months or quarters. If the focus is on comparing several categories, a bar or column chart may be clearer.
Profitability should normally be presented alongside revenue rather than in isolation. A business can increase revenue while margins decline if costs rise faster than sales. Showing revenue, gross profit, and margin together creates a more complete interpretation.
For example, imagine a hypothetical company whose revenue rises from $800,000 to $900,000 while gross margin falls from 42% to 36%. The dashboard should make the apparent growth visible while also signaling the deterioration in margin. The management question then changes from “Are sales growing?” to “Why is additional sales volume producing less gross profit?”
Trend charts should have consistent time periods and labels. Mixing calendar months with fiscal periods without explanation can create false comparisons. The dashboard should clearly identify whether values are monthly, quarterly, year-to-date, trailing twelve months, or forecast.
When space is limited, a compact trend chart with a target line can be more useful than several separate charts. The objective is not to show every available series; it is to show the relationship that helps the reader interpret performance.

3. Budget versus actual analysis
Budget variance is one of the most practical components of a financial dashboard. It tells the user whether actual performance is above or below a planned amount. Depending on the metric, being above budget can be positive or negative, so the dashboard should define the desired direction rather than assuming that every positive variance is good.
Revenue above budget may normally be favorable, while operating expenses above budget may require investigation. A dashboard can therefore calculate a variance amount and a variance percentage while applying business-specific interpretation.
A useful budget view might contain budget, actual, variance, variance percentage, and status. For example, a hypothetical department with a $100,000 budget and $108,000 actual spending has an $8,000 unfavorable expense variance, equivalent to 8% over budget.
Variance thresholds should be established thoughtfully. A flat rule such as “red above 5%” may not work across every account. A $5,000 difference may be significant for one cost center and immaterial for another. Some organizations therefore use both percentage and absolute-value thresholds.
The best dashboard does not stop at identifying a variance. It encourages investigation by showing the driver. If travel expense is above budget, for example, a second-level analysis might identify which department, project, location, or period generated the increase.

Financial Metrics Worth Including
A professional dashboard should contain a focused selection of metrics rather than every number available in the accounting system. The right set depends on the organization’s objectives, business model, reporting frequency, and audience.
Common financial metrics include revenue, gross profit, gross margin, operating expenses, operating profit, net profit, operating cash flow, cash balance, accounts receivable, accounts payable, current ratio, quick ratio, working capital, budget variance, forecast variance, and selected leverage measures.
Revenue explains the top line, but profitability explains how much economic value remains after costs. Gross margin is especially useful when management needs to understand pricing, product mix, production costs, or service delivery economics.
Liquidity measures answer a different question: can the organization meet its near-term obligations? Cash balance, operating cash flow, current assets, current liabilities, receivables, and payables can therefore be more important than profit alone in periods when cash availability is constrained.
The final selection should be connected to decisions. If a metric cannot reasonably influence a management action, it may belong in detailed reporting rather than the main dashboard. This keeps the dashboard compact and reduces visual noise.

Designing the Visual Hierarchy
Visual hierarchy determines the order in which the reader notices information. The most important measures should be easier to find than secondary detail. A common structure is to place headline KPIs at the top, major trends in the middle, and detailed breakdowns below.
Spacing is just as important as color. Crowded dashboards make individual charts compete for attention. Consistent margins, aligned chart edges, and restrained use of borders can create a clearer structure without requiring decorative elements.
Color should communicate meaning consistently. If green represents favorable performance in one chart, using green for an unfavorable result elsewhere can confuse the reader. A limited palette is usually easier to maintain than a different color for every category.
Charts should also match the question. Bar charts are generally useful for comparing categories. Line charts are effective for trends. Waterfall charts can explain how a starting value changes through a sequence of increases and decreases. Tables are appropriate when exact values matter.
Three-dimensional charts and decorative effects often add complexity without improving interpretation. The goal of a professional dashboard is not to demonstrate every formatting feature available in a spreadsheet application. It is to make important financial information easier to understand.

Building the Data Foundation
The visible dashboard is only as reliable as its underlying data. Before formatting charts, establish a clean source table containing fields such as transaction date, account, department, category, entity, region, product, amount, and reporting period where relevant.
Use consistent data types. Dates should be stored as dates rather than text. Amounts should be numeric. Account names should follow a controlled naming convention. Duplicate transactions should be identified before they reach the dashboard layer.
Separate raw data from transformed data and dashboard calculations when possible. This creates a clearer audit trail and makes it easier to determine whether an unexpected number comes from the source, transformation logic, or presentation formula.
Document important assumptions. If revenue excludes certain transactions, if expenses are allocated by a particular method, or if a forecast uses a specific assumption, record that information in a notes or methodology area.
Data preparation is particularly important when moving from Excel into Power BI. Microsoft recommends preparing the data before building the report because the report design depends on having a properly structured and cleaned data model. That principle applies broadly to financial dashboards regardless of the software used.

Excel as a Financial Dashboard Platform
Excel remains useful for dashboard work because it combines formulas, tables, PivotTables, PivotCharts, formatting, and familiar spreadsheet workflows. Microsoft specifically documents the use of PivotTables, PivotCharts, slicers, and timelines for creating dynamic Excel dashboards.
A practical workbook structure can contain an Inputs or Raw Data sheet, a Calculations sheet, a Dashboard sheet, and optional supporting schedules. Keeping the dashboard itself relatively clean makes it easier to print, present, or export.
Excel is especially useful when users need to adjust assumptions manually. A finance analyst can change a budget value, add a reporting month, update a forecast, or investigate a transaction without leaving the workbook.
However, spreadsheet flexibility creates governance risks. Formulas can be overwritten, source data can be copied incorrectly, and different users may create inconsistent versions. A professional workbook should therefore protect critical formulas, clearly identify input cells, and maintain a documented update procedure.
For recurring reporting, consider a refresh workflow rather than manual copy-and-paste. Structured tables, Power Query, PivotTables, and controlled input areas can reduce repetitive work while making the workbook easier to maintain.

Google Sheets for Collaborative Financial Dashboards
Google Sheets can be a useful option when multiple people need to collaborate in a browser-based environment. It is particularly practical for teams that already work in Google Workspace and want shared access to inputs, calculations, and dashboard views.
A collaborative dashboard should still use controlled data structures. Shared access does not eliminate the need for consistent definitions, protected calculation ranges, and clear ownership of updates.
One useful model is to maintain a transaction or input sheet, a calculation area, and a dashboard sheet. Contributors can enter approved source information while the dashboard uses formulas, pivot tables, or connected data to produce the management view.
Google Sheets can also work well for lightweight planning and budgeting where the underlying dataset is manageable. When transaction volume, transformation complexity, or interactive reporting requirements become substantial, a dedicated data model or BI platform may be more appropriate.
The most important design principle is that collaboration should not compromise financial control. Decide who owns the source data, who approves changes, how reporting periods are closed, and how historical values are preserved before making the dashboard widely editable.

Power BI for Interactive Financial Reporting
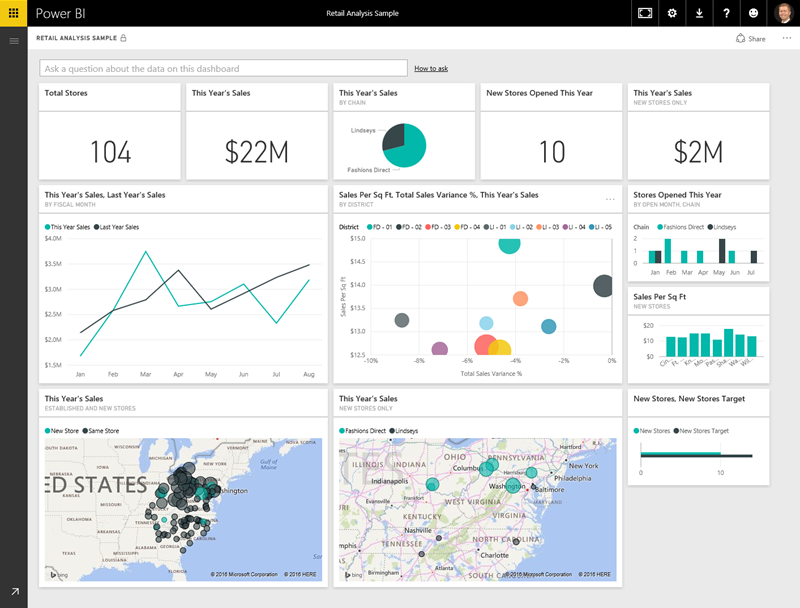
Power BI is well suited to financial dashboards that require connected data, interactive filters, reusable semantic models, and multiple levels of analysis. Microsoft describes dashboards as a single-page visual story containing the most important elements, while underlying reports and models provide greater detail.
A Power BI financial dashboard can connect data from sources such as Excel, accounting systems, databases, or other structured sources. Once the data model is prepared, measures can calculate revenue, margins, variances, liquidity indicators, and other KPIs.
Interactive features can help users move from summary to detail. A finance manager might begin with total expense variance, filter to a department, identify the largest category, and then examine the underlying transactions or reporting dimensions.
Power BI also supports KPI visuals that compare a measure with a target and can show a trend axis. This makes it useful when a financial dashboard must communicate both current status and movement toward a goal.
The main caution is complexity. Power BI can support sophisticated models, but a sophisticated data model does not automatically produce a better dashboard. The same principles of audience focus, visual hierarchy, clear definitions, and restrained presentation still apply.
PowerPoint, Word, and PDF Versions
PowerPoint is useful when financial dashboard information must be presented to executives, management teams, or other stakeholders in a meeting. A PowerPoint version should usually be treated as a presentation layer rather than the primary data source.
The most effective presentation slide typically focuses on the financial story: headline results, major movements, significant variances, and management actions. It should not simply paste an entire spreadsheet onto a slide.
Word can be useful for a narrative financial report where charts need to sit beside commentary, assumptions, recommendations, or formal management notes. A Word-based report can combine a dashboard summary with explanations of significant movements.
PDF is often useful for preserving a final layout for distribution or archiving. A PDF dashboard can be appropriate when recipients need a fixed representation of the reporting period rather than an interactive workbook.
When creating these formats, maintain the same metric definitions and reporting period across the source dashboard and exported documents. A polished presentation with inconsistent numbers is worse than a simple report that is clearly reconciled.

Cash Flow, Liquidity, and Working Capital
Profitability and cash flow should not be treated as interchangeable. A business can report accounting profit while experiencing cash pressure because customers have not paid, inventory has increased, capital expenditures have occurred, or financing obligations have changed.
A cash-flow dashboard can therefore track opening cash, operating inflows, operating outflows, investing activity, financing activity, closing cash, and forecast cash where the data supports it. Accounts receivable and accounts payable can add important context.
Working capital metrics can help explain the timing of cash movements. Receivables show money owed by customers, while payables show obligations to suppliers and other parties. Aging analysis can reveal whether outstanding balances are becoming older than expected.
Cash runway may be relevant for organizations that monitor burn rate. It should be calculated from clearly defined assumptions rather than presented as an unquestionable prediction. Forecast outputs should always be distinguishable from actual historical figures.
The practical purpose of this section is early awareness. If cash is declining, receivables are aging, and planned expenses remain high, the dashboard should make the combination visible early enough for management to investigate possible responses.

Accounts Receivable and Accounts Payable
Receivables dashboards help finance teams understand how much money remains unpaid and how long those balances have been outstanding. Common measures include total receivables, overdue receivables, aging buckets, days sales outstanding, and collection performance.
A useful aging view might divide balances into current, 1–30 days, 31–60 days, 61–90 days, and 90-plus days. The exact ranges can vary by business and payment terms, so they should reflect the organization’s actual collection process.
Accounts payable dashboards provide the complementary view. They can show unpaid supplier obligations, overdue balances, payment timing, and upcoming commitments. This can support cash planning and help finance teams understand near-term obligations.
Neither dashboard should encourage indiscriminate payment or collection behavior. The purpose is visibility and prioritization. A large overdue balance may require investigation into a dispute, billing error, customer issue, or contractual condition before a simple collection action is appropriate.
When combined with cash-flow information, AR and AP dashboards can provide a stronger liquidity story. The user can see not only the cash balance but also the timing of money expected to arrive and obligations expected to leave the business.

Forecasting and Scenario Analysis
A financial dashboard becomes more valuable when it distinguishes historical performance from forward-looking information. Actual values explain what has happened, while forecasts and scenarios help management consider what may happen under stated assumptions.
A basic forecast can extend revenue, expenses, and cash trends into future periods. More sophisticated models may use drivers such as units sold, price, headcount, customer retention, supplier costs, or planned investment.
Scenario analysis should be transparent. Instead of presenting one forecast as certain, a template can show base, upside, and downside cases. Each scenario should have documented assumptions so that users understand what changes between them.
Forecast accuracy can itself become a dashboard KPI. Comparing previous forecasts with actual outcomes helps the finance team identify where assumptions consistently miss reality. The purpose is not to punish forecasting error but to improve planning quality over time.
Scenario analysis should also avoid excessive complexity. A dashboard with dozens of assumptions may be technically impressive but difficult to use. Start with the variables most likely to change the financial outcome and add detail only when it supports a real decision.
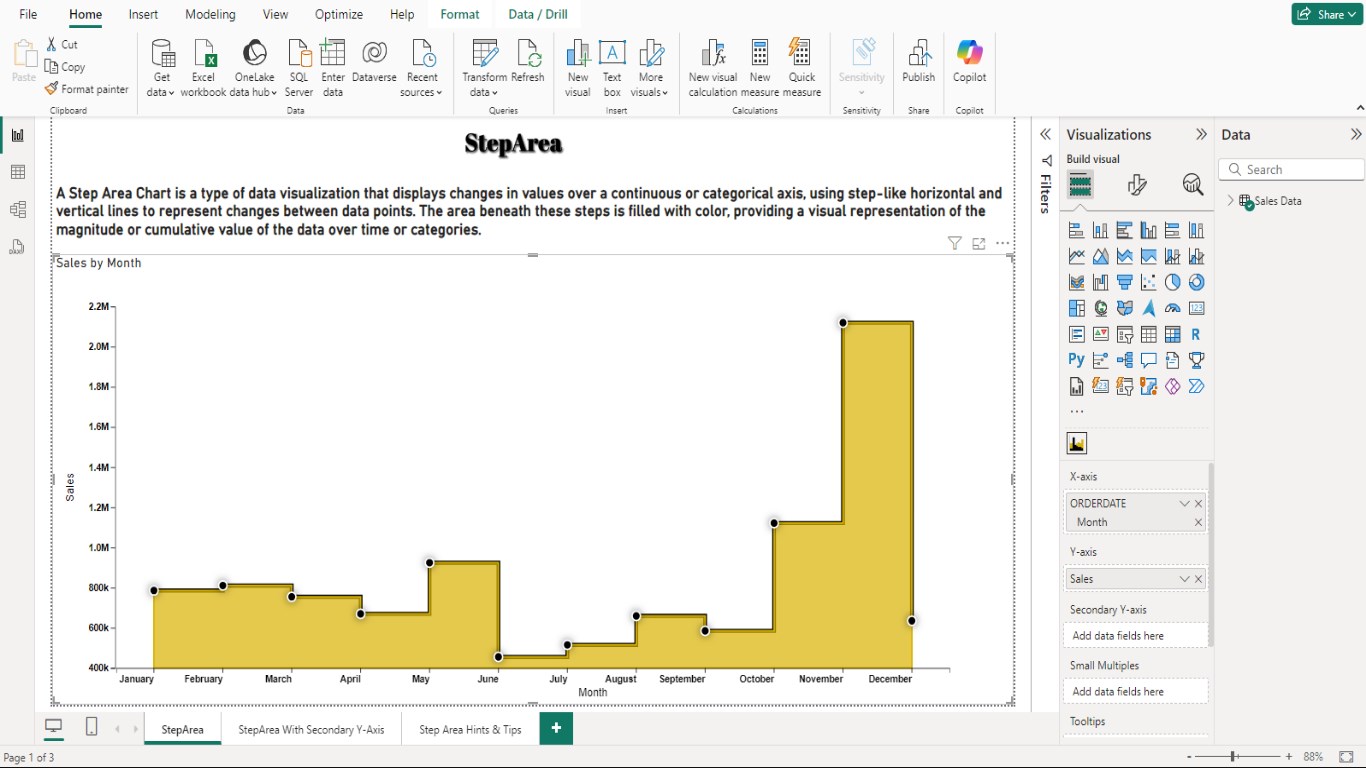
How to Create a Professional Design Financial Dashboard Template Step by Step
Step 1: Define the reporting objective
Begin with the decision the dashboard is supposed to support. An executive dashboard might focus on overall financial health. A departmental dashboard might focus on cost control. A cash dashboard might focus on liquidity and timing.
Write down the main questions before choosing charts. This prevents the common mistake of starting with attractive visualizations and then searching for a reason to use them.
For example, a monthly management dashboard could ask: Are revenue and gross profit on plan? Which expenses are creating the largest unfavorable variances? Is operating cash flow improving? Which receivables require attention? Is the forecast still credible?
Those questions immediately suggest the types of measures required. They also help eliminate metrics that are interesting but not necessary for the reporting purpose.
Once the objective is clear, define the audience and reporting frequency. A weekly cash dashboard and a quarterly board dashboard may share some metrics, but they should not necessarily have the same level of detail.
Step 2: Define metric formulas
Write down the definition of every headline KPI before building the visual layer. For example, define exactly what “revenue,” “operating expense,” “gross margin,” and “cash balance” mean in the dashboard.
For ratios, document numerator and denominator. For variance percentages, document whether the calculation is actual minus budget divided by budget, or another agreed convention. For metrics where lower is better, document the desired direction.
Metric definitions become especially important when multiple systems contribute data. An accounting system may recognize revenue differently from a sales system. The dashboard should specify which source governs the official financial measure.
Include reporting-period rules. A dashboard should not silently combine calendar-month transactions with fiscal-period targets. If the organization uses a fiscal year that differs from the calendar year, make the period structure visible.
Finally, identify who owns each metric. Ownership makes it easier to resolve questions when a number changes unexpectedly or when the underlying source system is updated.
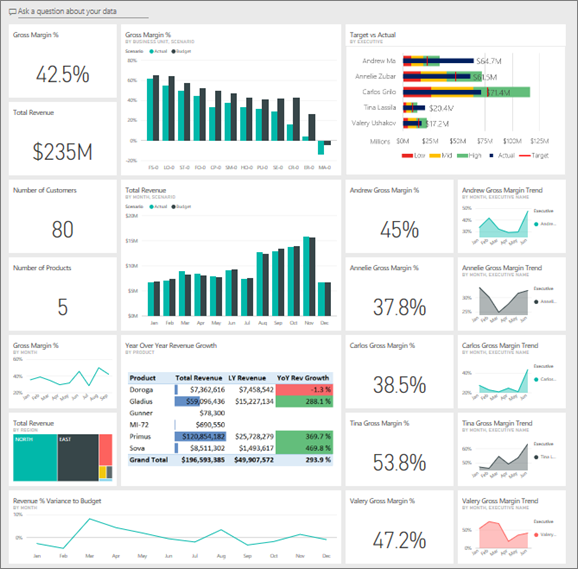
Step 3: Build the data model
Create the source structure before styling the dashboard. In a spreadsheet, this may mean converting raw records into a structured table. In Power BI, it may involve importing data, cleaning fields, creating relationships, and defining measures.
Use stable identifiers where possible. Department codes, account codes, product IDs, and customer IDs are generally more reliable than manually typed descriptions when connecting datasets.
Check for missing values and duplicates. A duplicated transaction can distort revenue or expenses while remaining difficult to notice on a polished dashboard. Validation should therefore happen before visualization.
Reconcile important totals with trusted financial statements or accounting reports. If the dashboard revenue does not agree with the official revenue figure, stop the reporting workflow and resolve the difference rather than hiding it through formatting.
Maintain a refresh or update log when the dashboard is used regularly. Record the reporting period, data refresh date, source status, and any known exceptions. This creates a simple operational control around the dashboard.

Step 4: Create the dashboard layout
Start with the highest-priority information. A practical layout often places KPI cards across the top, followed by revenue and profitability trends, budget variance analysis, and liquidity or working-capital detail.
Group related metrics together. Revenue, gross profit, and gross margin belong together because they tell a connected profitability story. Cash balance, operating cash flow, receivables, and payables belong together because they explain liquidity.
Keep chart titles explicit. “Revenue Trend” is usually clearer than a decorative title such as “Growth Story.” If the chart compares actual with budget, say so directly.
Use consistent number formats. Currency, percentages, days, and ratios should not be visually mixed without clear labels. A reader should know immediately whether “45” means $45, 45%, 45 days, or a ratio.
Design for the display environment. A dashboard intended for a large monitor can contain more information than one designed for a laptop or mobile device. Responsive and simplified versions may be appropriate when the same data needs to serve multiple viewing contexts.

Step 5: Add interaction carefully
Filters and slicers can make a dashboard significantly more useful when users need to examine departments, regions, products, customers, or periods. However, every filter adds a decision point for the user.
Only expose filters that are likely to be used. A dashboard with fifteen slicers may technically provide flexibility but can overwhelm a reader. A small set of high-value filters is usually easier to understand.
Make filter states visible. If a dashboard is filtered to one region or month, the user should be able to tell that immediately. Hidden filters are a common source of misinterpretation.
When using Power BI, remember that dashboards, reports, and semantic models have different roles. A dashboard can provide a high-level view while the underlying report supports deeper analysis. This distinction can help keep the main page focused.
For Excel, slicers and timelines can provide a similar experience for PivotTables and PivotCharts. The underlying principle remains the same: interaction should help the reader answer a question, not exist merely because the software supports it.

Practical Example: Monthly Management Dashboard
Consider a hypothetical company that sells equipment to commercial customers. Management wants one monthly dashboard showing revenue performance, profitability, operating costs, and cash position.
The top row could contain revenue, gross profit, gross margin, operating profit, and cash balance. Each card could compare the current month with budget and the prior year where appropriate.
The next section could show a twelve-month revenue trend and a twelve-month gross-margin trend. A budget-versus-actual chart could identify the largest expense categories, while a waterfall could explain the movement from budgeted operating profit to actual operating profit.
The bottom section could show receivables aging, payables due, and cash-flow movement. These measures would help management understand whether accounting profitability is translating into available cash.
Finally, a commentary area could contain three concise observations: the largest favorable movement, the largest unfavorable movement, and the most important action or investigation. This converts the dashboard from a passive display into a management communication tool.

Practical Example: Budget-Control Dashboard
A department-level dashboard may have a narrower purpose. Imagine a company that wants department managers to monitor spending against annual budgets.
The dashboard could show total budget, actual spending, remaining budget, and variance. A monthly trend would reveal whether spending is accelerating. A category chart could show which expense types consume the largest share.
A ranking table could identify departments with the largest unfavorable variance. Managers could then drill into the affected categories rather than reviewing every department equally.
Thresholds can be used to focus attention, but they should be documented. A red status might mean that spending is materially above budget, while an amber status could indicate a developing variance that requires monitoring.
The dashboard should also distinguish timing differences from genuine overspending. A large monthly variance can occur because an invoice was recorded earlier or later than expected. Good financial reporting therefore combines numerical signals with accounting context.

Common Mistakes to Avoid
The first mistake is overcrowding. Adding more charts does not automatically make a dashboard more useful. Too many visuals force the reader to decide where to look before understanding the main message.
The second mistake is using inconsistent definitions. If one page calculates profit before a certain cost and another calculates profit after it, the same label can produce apparently contradictory results.
The third mistake is showing numbers without comparison. A current-period value is rarely enough to judge performance. Where appropriate, include a target, prior period, prior year, forecast, or benchmark.
The fourth mistake is relying on color alone. A user should not need to distinguish only between red and green to understand status. Include labels, symbols, variance values, or explanatory text where practical.
The fifth mistake is confusing forecasts with actuals. Historical results should be visually distinguishable from estimates. This is especially important when dashboards are used in executive or financial planning discussions.

Best Practices for a Professional Dashboard
Use a clear reporting date. Every dashboard should tell the reader what period the numbers represent and when the data was refreshed.
Keep metric definitions accessible. A small methodology section or supporting documentation can prevent repeated questions about how figures are calculated.
Reconcile headline values. Revenue, profit, cash, and other critical measures should be checked against trusted sources before distribution.
Use consistent visual language. Keep the same terminology, units, status logic, and chart conventions across reporting periods.
Review the dashboard with actual users. A template that looks excellent to its designer may still hide the information a finance manager needs. User testing should focus on whether people can answer the intended questions quickly and accurately.
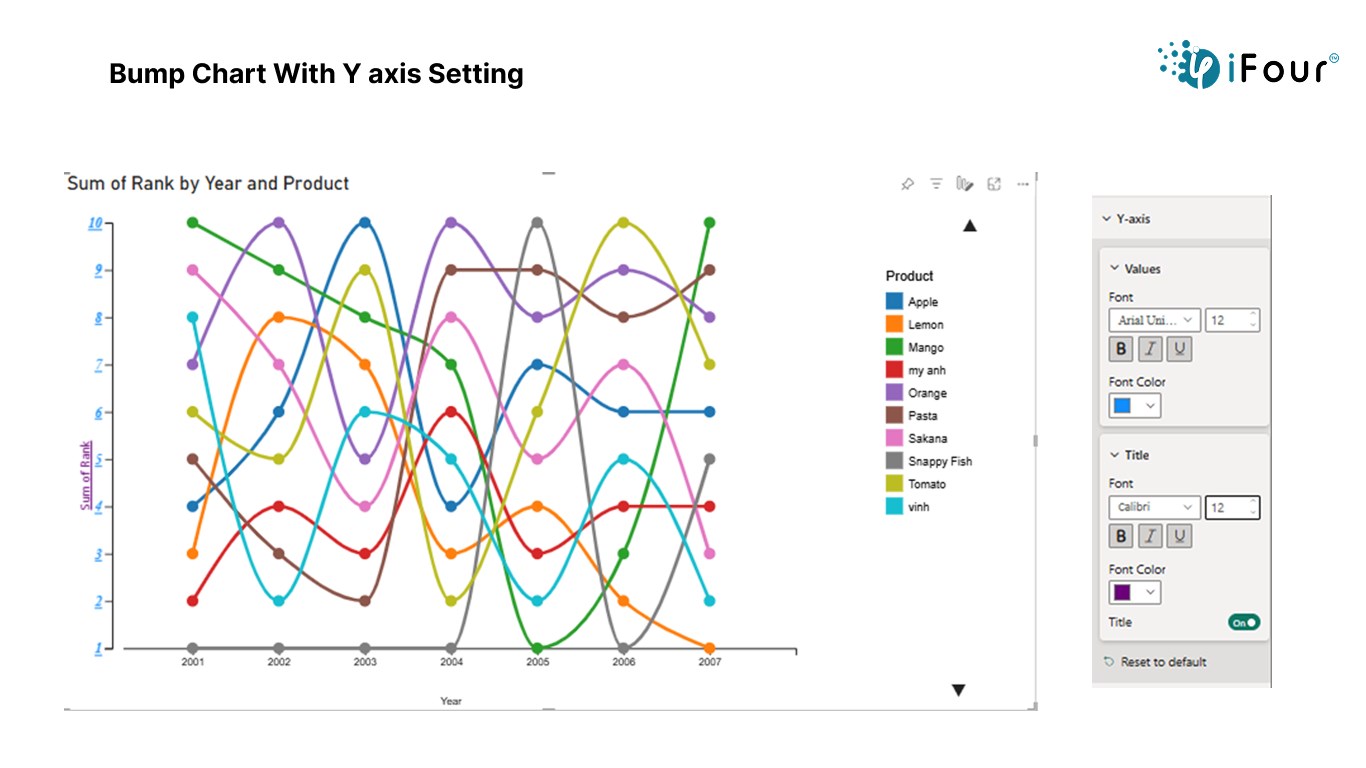
Professional Design Financial Dashboard Template: Choosing the Right Format
The right format depends on how the dashboard will be used. Excel is often the best starting point when users need editable formulas and familiar spreadsheet tools. Google Sheets is useful when browser collaboration is a priority. Power BI becomes more attractive when data integration and interactive analysis are central requirements.
PowerPoint is strongest as a presentation layer. Word is useful for narrative reporting, and PDF is useful for a fixed, distributable version of a report. These formats do not necessarily compete; they can form a reporting workflow in which one analytical source produces several communication outputs.
For example, a finance team could maintain the core model in Excel or Power BI, produce a management dashboard for regular monitoring, export selected visuals into PowerPoint for a leadership meeting, and generate a PDF archive of the approved reporting pack.
The important control is to maintain a single source of truth. If numbers are manually retyped into every format, inconsistencies become more likely. Where practical, automate or standardize the transfer of approved figures into presentation documents.
Do not select a platform solely because its dashboards look attractive in examples. Evaluate data volume, refresh requirements, collaboration needs, security, user skills, calculation complexity, and the level of interactivity required.
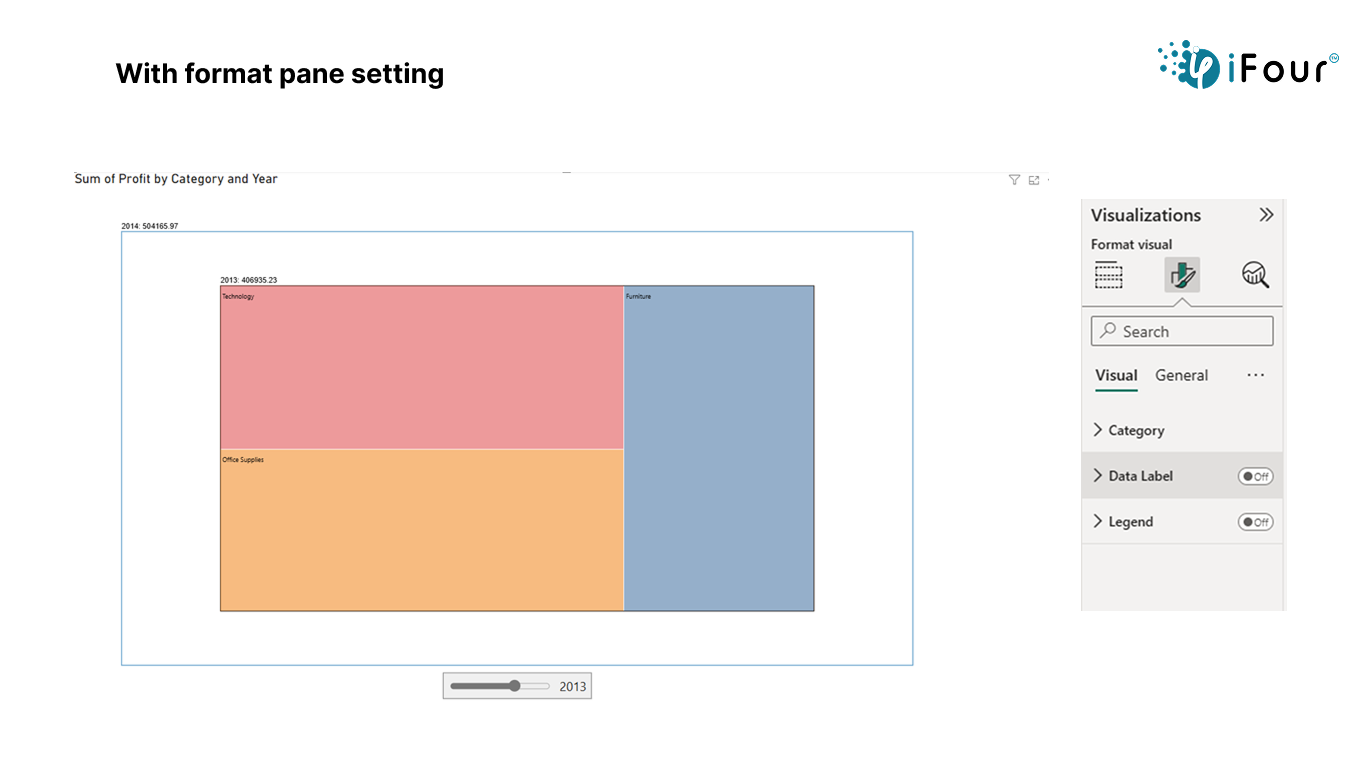
How to Evaluate a Template Before Using It
Start with the formulas. A template should make it possible to understand where its numbers come from. If calculations are hidden, hard-coded, or poorly documented, customization becomes risky.
Next, inspect the data structure. Determine whether source data, calculations, and presentation are separated. A clean structure is usually easier to adapt than a workbook in which every element is mixed together.
Then examine the visual hierarchy. Can you identify the most important metrics immediately? Are charts labeled clearly? Is there enough space? Are comparisons visible?
Check whether the template supports your reporting period. Some templates assume twelve calendar months, while others may support quarters or fiscal periods. Adapting the time structure incorrectly can create misleading comparisons.
Finally, test it with a small sample of your own data. A template may look perfect with sample figures but become unreadable when your real account names, categories, or reporting dimensions are introduced.

Practical Solution
The most practical approach is to build the dashboard in layers rather than attempting to design the entire page at once. Begin with the reporting objective, define the metrics, validate the source data, calculate the measures, and only then finalize the visual presentation.
For a first implementation, limit the executive page to a manageable group of high-value KPIs. A useful starting structure is revenue, gross profit, gross margin, operating expense, operating profit, cash balance, budget variance, and a small number of working-capital indicators.
Next, create three analytical sections: performance, variance, and liquidity. Performance explains what the business generated. Variance explains how results compare with plan. Liquidity explains the cash consequences and near-term financial position.
Build a repeatable monthly workflow around those sections. Import or enter approved source data, refresh calculations, reconcile headline figures, review exceptions, update commentary, and then publish the approved dashboard. Record the refresh date and reporting period so users know which version they are viewing.
Use the dashboard as an investigation starting point rather than the final level of detail. If a metric is outside expectations, provide a clear route to supporting data. This could be a detailed Excel schedule, a Power BI report page, an accounts receivable aging table, or another controlled analysis.
Finally, review the template periodically. Remove metrics that no longer influence decisions, add indicators required by new business priorities, and simplify visuals that users consistently ignore. A professional dashboard should evolve with the reporting process instead of remaining frozen as a decorative template.
Reference Examples
The following examples illustrate different visual and document-oriented approaches that can inform the design of a financial dashboard. They are references for structure and presentation, not claims that any particular template is suitable for every organization.
professional design financial dashboard template excel
Source: Rowspeak
professional design financial dashboard template free download
Source: Bold BI
professional design financial dashboard template google sheets
Source: Pegadaian
professional design financial dashboard template excel free
Source: Eloquens
professional design financial dashboard template powerpoint
Source: Canva
professional design financial dashboard template free
Source: Bold BI
professional design financial dashboard template ppt
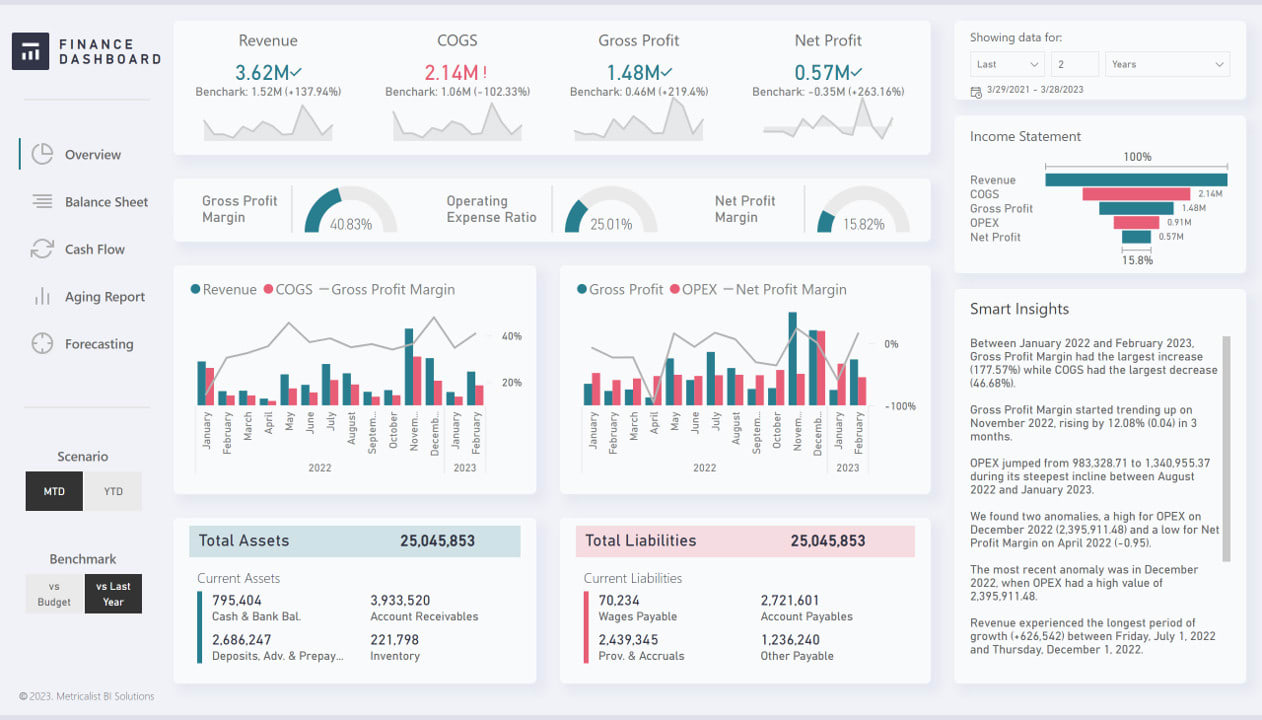
Source: Fiverr
professional design financial dashboard template power bi
Source: Microsoft Learn
professional design financial dashboard template word

Source: iFour Technolab
professional design financial dashboard template pdf
Source: Microsoft Learn
professional design financial dashboard template download
Source: Microsoft Learn
professional design financial dashboard template uk
Source: Hertfordshire County Council
Frequently Asked Questions
What should a professional financial dashboard contain?
A strong dashboard normally contains a focused set of financial KPIs, performance trends, budget-versus-actual analysis, profitability measures, liquidity indicators, and supporting breakdowns. The exact selection should reflect the organization’s decisions, reporting cadence, and audience.
Is Excel suitable for a financial dashboard?
Yes. Excel is particularly useful when users need editable calculations, PivotTables, PivotCharts, slicers, and familiar spreadsheet workflows. It becomes less suitable when data integration, governance, scale, or interactive reporting requirements become substantially more complex.
Can the same dashboard concept work in Google Sheets?
Yes. The underlying principles of KPI selection, data structure, visual hierarchy, and variance analysis remain the same. The main difference is how the spreadsheet is shared, refreshed, and governed.
When should a business consider Power BI?
Power BI can be useful when a dashboard needs connected data sources, reusable data models, interactive analysis, filtering, and deeper reporting layers. Microsoft provides financial and customer profitability samples that demonstrate how dashboards, reports, and semantic models can work together.
Should a dashboard show every financial metric?
No. A dashboard should emphasize metrics that support decisions. Detailed schedules can contain additional information while the main dashboard remains focused on the most important signals.
How often should a financial dashboard be updated?
The appropriate cadence depends on the business. Cash management may require frequent updates, while a strategic management dashboard may be reviewed weekly or monthly. The important point is to establish a consistent cadence and clearly display the reporting period and refresh status.
What is the most important financial dashboard KPI?
There is no universal single KPI. Revenue, profit margin, operating cash flow, cash balance, budget variance, and working-capital measures can all be important depending on the organization’s objectives and financial risks.
How can a dashboard avoid misleading users?
Use accurate source data, documented formulas, clear reporting periods, meaningful comparisons, consistent definitions, and visible distinctions between actuals and forecasts. Reconcile important totals before distributing the dashboard.
Conclusion
A professional design financial dashboard template should make financial information easier to understand, compare, investigate, and act upon. The strongest templates are not simply attractive collections of charts. They combine reliable data, clearly defined metrics, appropriate comparisons, thoughtful visual hierarchy, and a workflow that supports recurring reporting.
Whether the final implementation uses Excel, Google Sheets, Power BI, PowerPoint, Word, or PDF, the fundamental principles remain consistent: start with the decisions, build a trustworthy data foundation, prioritize meaningful KPIs, show context, distinguish actuals from forecasts, and provide a path from headline results to supporting detail.
Used properly, a professional design financial dashboard template can become the central visual layer of a finance reporting process. It can help leaders see changes sooner, focus investigations on significant variances, understand liquidity, communicate financial performance clearly, and turn recurring reporting from a collection of spreadsheets into a more consistent decision-support system.
